

How GMAP’s Dashboard Reporting Can Add Life to Your Data
21st April 2022
GMAP’s Reporting
services include bespoke reports, reporting dashboards and live reporting capabilities that can help to provide geographical insight into your sales, customer, and other company data to inform business decision-making.
With GMAP Business Intelligence services, we can build bespoke solutions that enable you to see data in an easy-to-use report dashboard which can be used by any stakeholders in your business. GMAP’s datasets can be built into your reports to enhance your data and ensure every initiative is as learned as possible.
From small bespoke reports to widely distributed live information services to hundreds of users, GMAP have experience in deploying the latest tools to distribute informative market intelligence efficiently and securely.
Sales Reporting & Targets
We can build you a bespoke report specifically for your business, which using your company sales data, can help you to understand how each of the points in your network is performing on a continual basis in an easy-to-use interactive dashboard.
In addition, we can work with you to create sales targets for each point in your retail network which can help you to plan efficiently and effectively. This can also be used in your Sales Reporting to benchmark performance.
Measure Your Progress in Achieving Your Ideal Network Plan
At GMAP, the core of our offering is our Location Planning Consultancy
services in which we create Ideal Network Plans
(INPs) for a whole host of clients across multiple sectors including automotive, retail, leisure, fuel forecourt. We can deliver the outputs of your Ideal Network Plan in a reporting dashboard, which can be used to measure the progress towards implementation.
GMAP Reporting in Practice
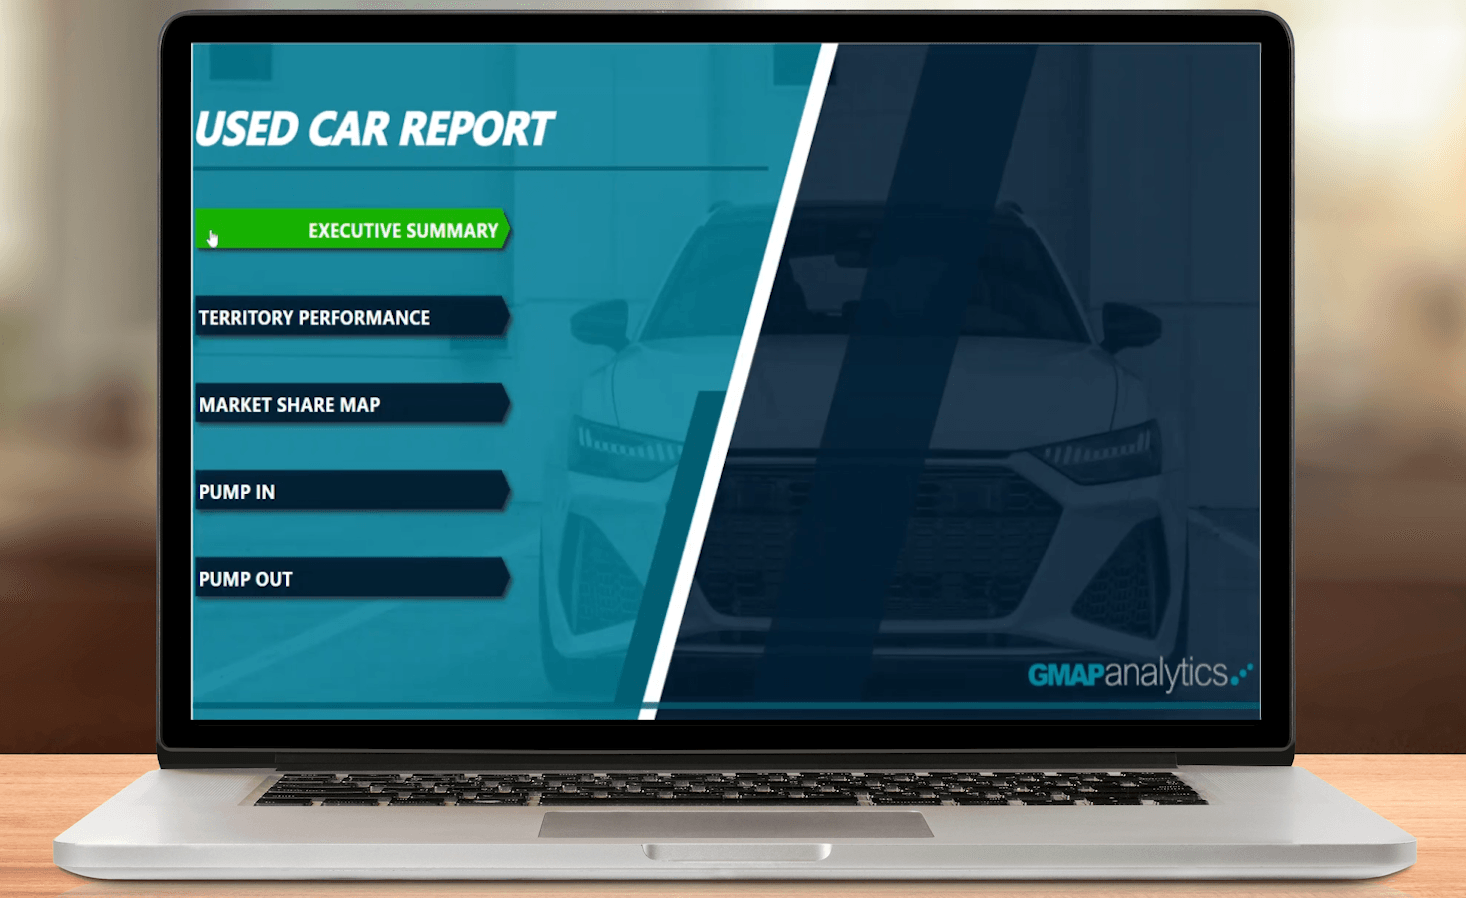
1. The Used Car Report Dashboard Tool
The Used Car Report is just one example of how GMAP have built a dashboard to inform client decisions.
The Used Car Report is a Reporting Dashboard solution we have created at GMAP, which combines DVLA transaction data
with client sales data. This can be used to assess how your Dealer Network is performing against the territory market and can inform vehicle stocking profiles.
Data can be viewed as charts, tables, or maps depending on your requirement. Within the Used Car Report you can filter, sort, and interact with the data to quickly analyse performance:
- Geographically by Territory, Post Sector and Drive Time
- By Vehicle Segment
- By Propulsion (e.g. BEV vs. ICE)
- By Transaction Type
- By Make and Model
- Temporally and Year-on-Year
Watch the video below to see an example of the Used Car Report brought to life and see an example of what GMAP’s Reporting Dashboards offering could look like to you.
With the turbulent changes in the automotive industry in recent years, and turn towards Electric Vehicles, the DVLA dataset and Used Car Report is more important than ever. To find out more about the Used Car Report how could support you, or the DVLA Car Registrations Data, please get in touch at info@gmap.com.
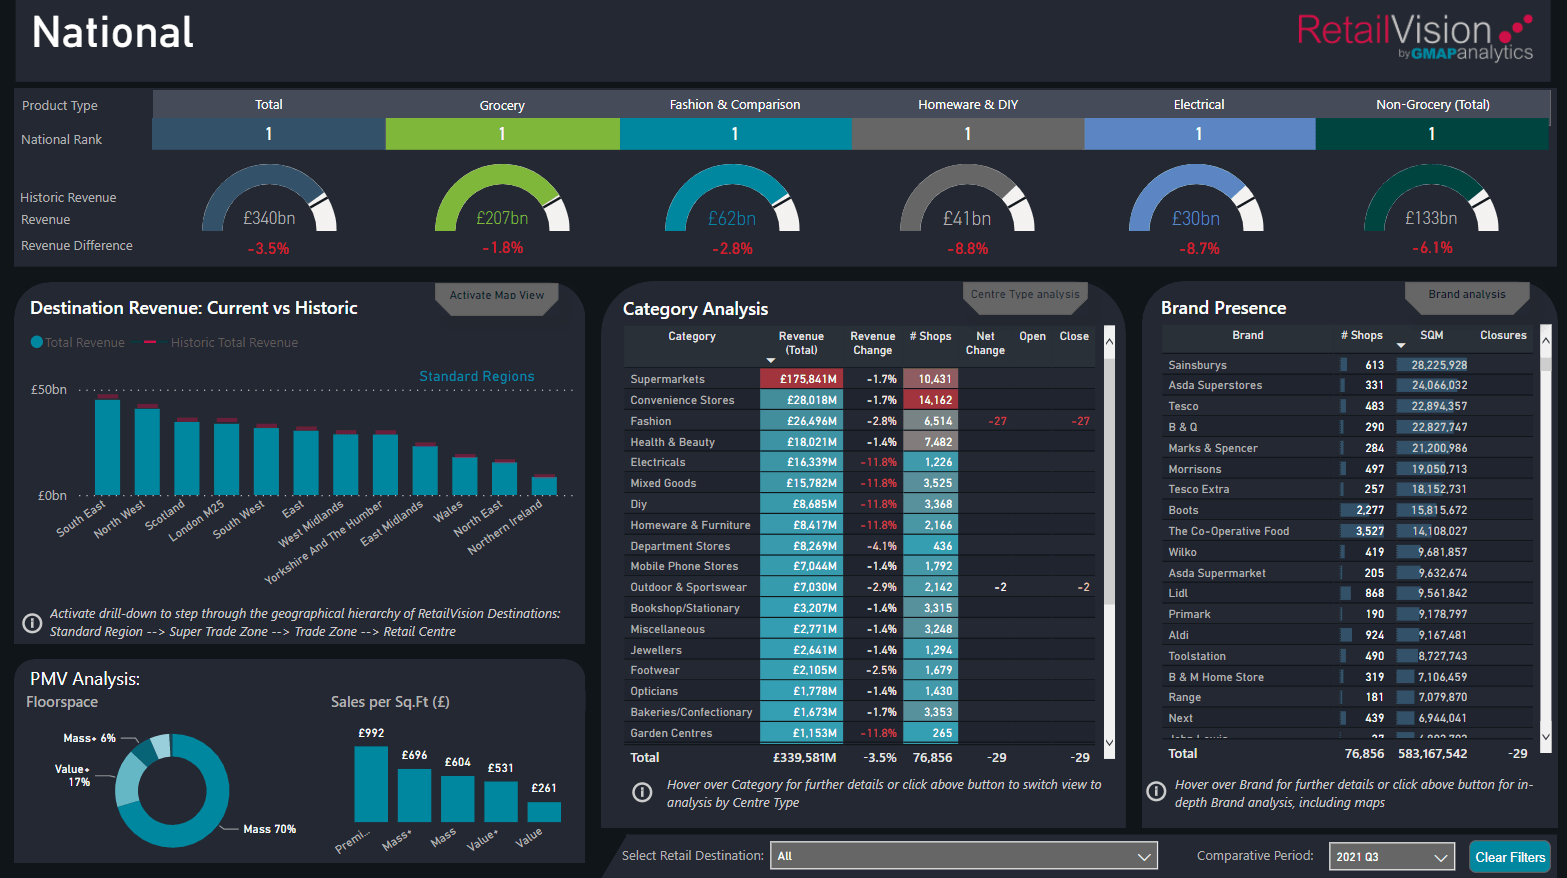
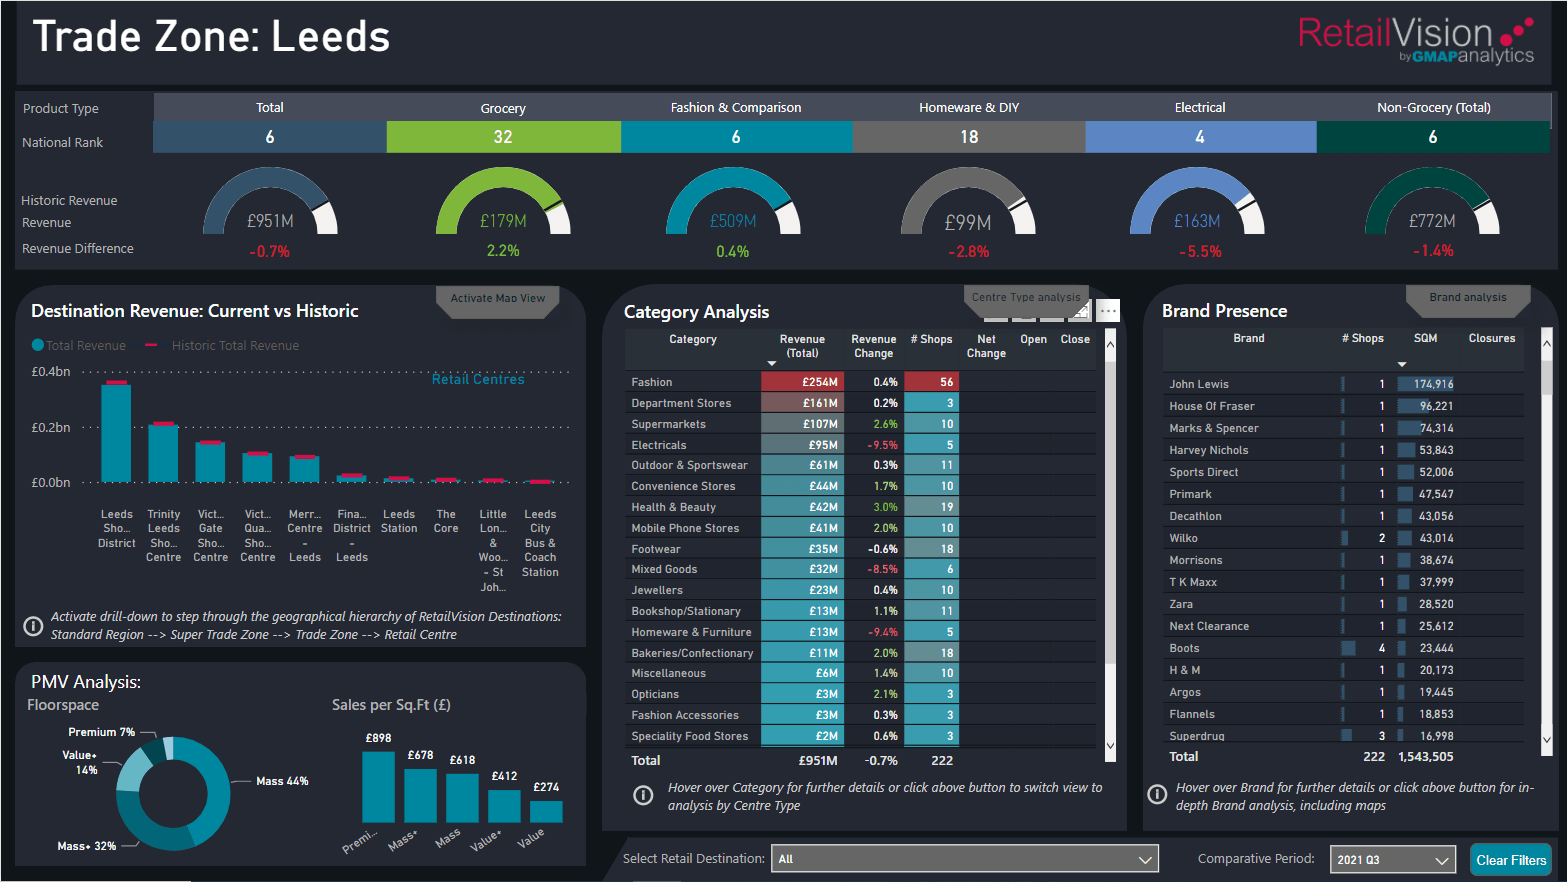
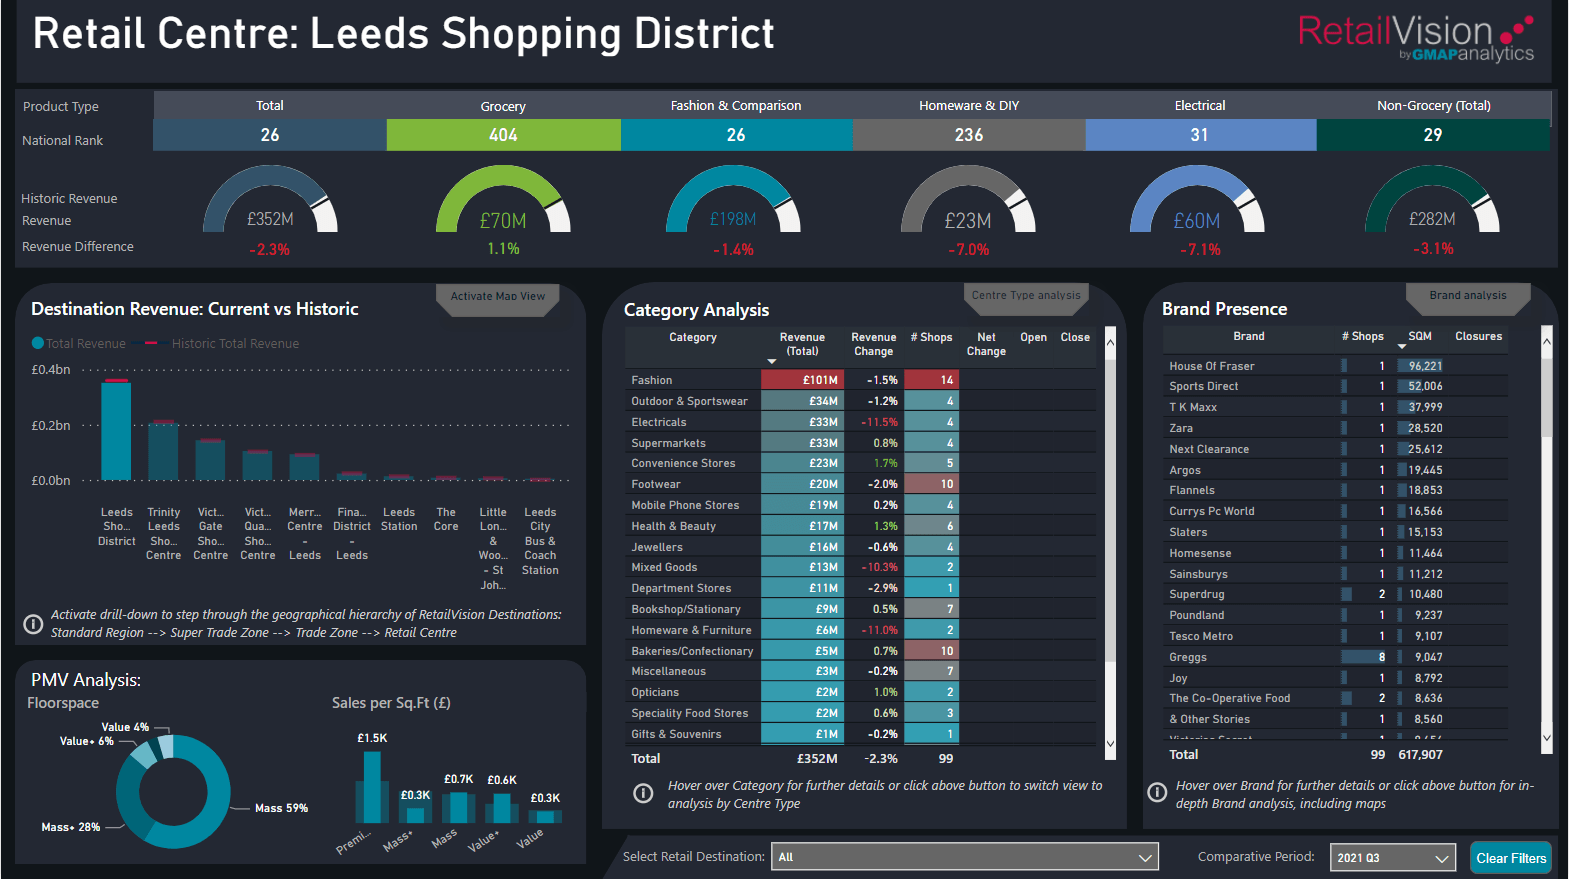
2. The RetailVision Dashboard Tool
RetailVision by GMAP
is designed to provide stakeholders with a comprehensive depiction of the UK retail landscape. RetailVision consists of RetailVision Points, a competitively priced retail locations dataset with coverage of over 80,000 stores for 800 brands, and RetailVision Destination, which provides a detailed illustration of the UK’s retail landscape.
As part of our RetailVision data offering, we offer an off-the-shelf dashboard solution as part of our RetailVision data offering. The RetailVision Dashboard Tool can be used to:
- Visualise the RetailVision Points dataset to analyse competitor and affinity store portfolios.
- Use RetailVision Destinations quickly see the breakdown of typical Centre attributes of the Retail Centres in which your competitors are located, such as Centre Type, Centre Revenues, and Average Floorspaces.
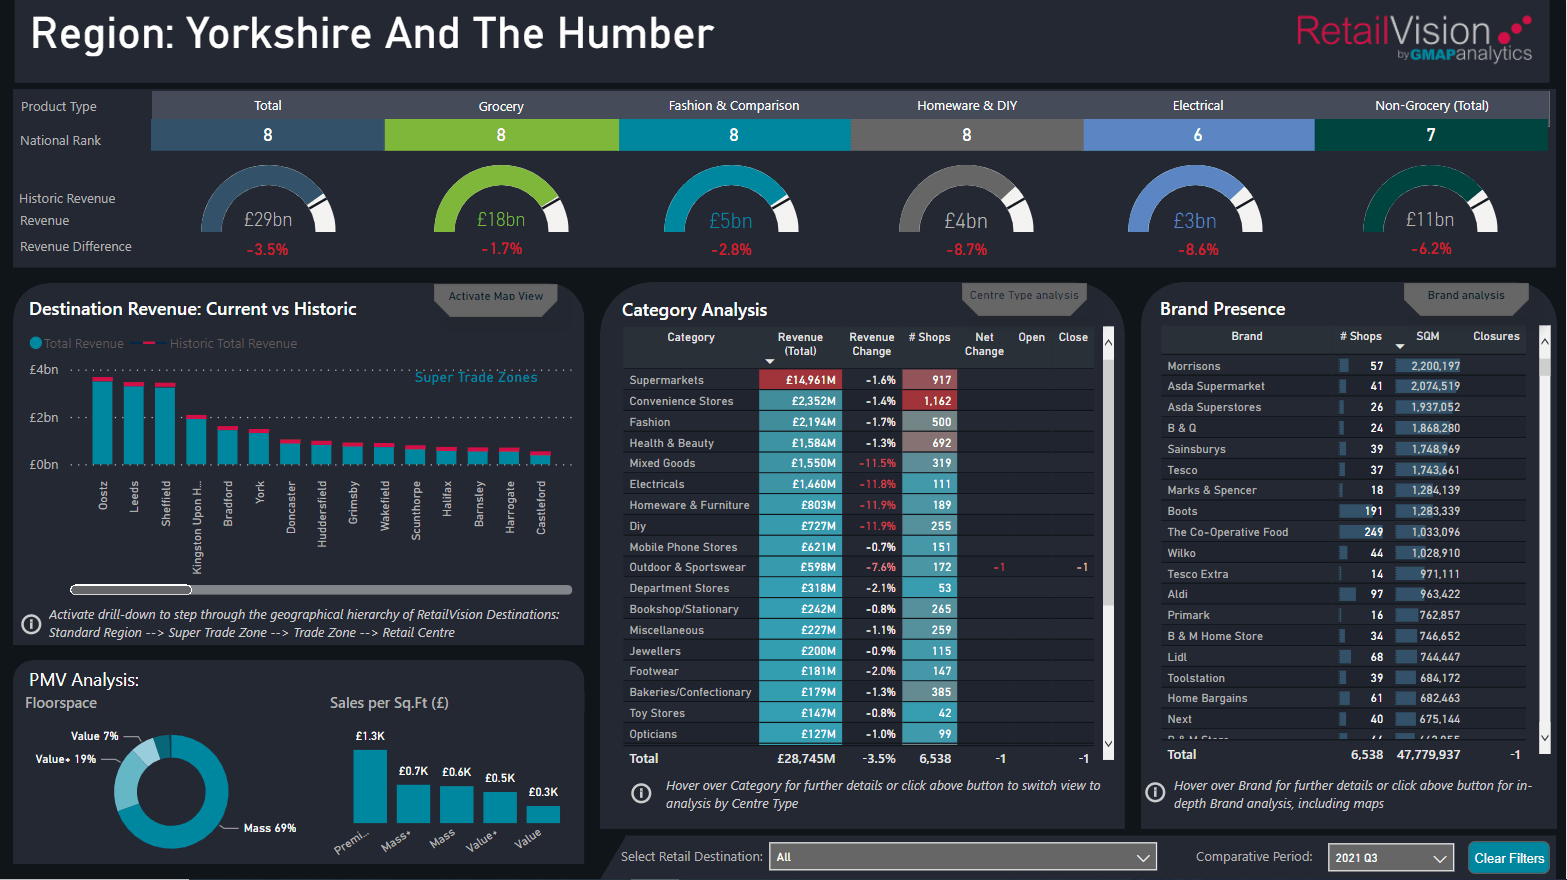
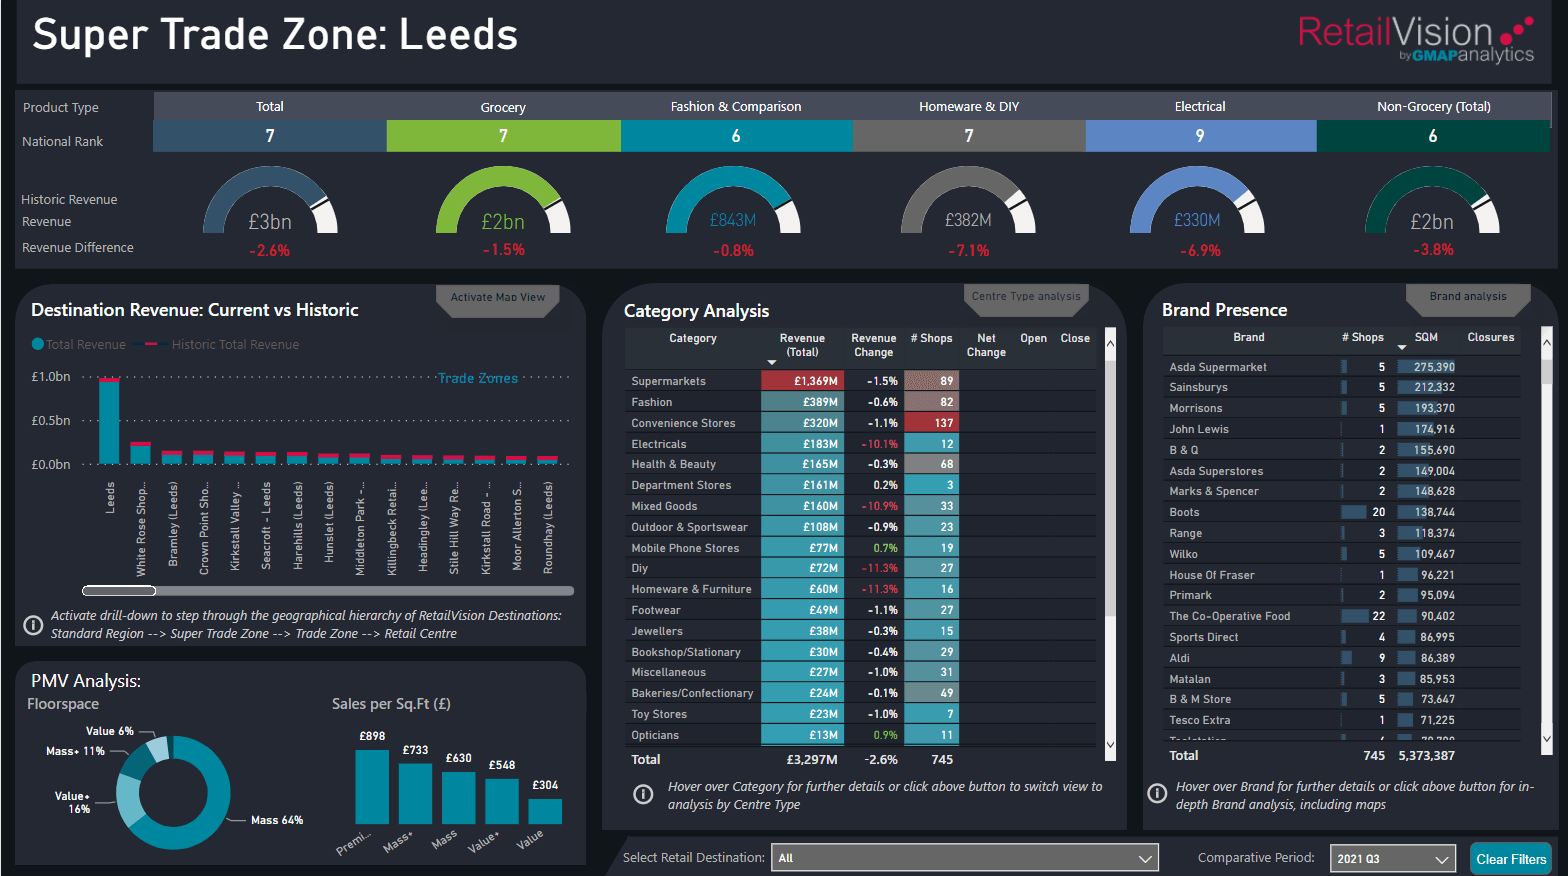
- Compare Retail Centres, Trade Zones and Super Trade Zones nationally, or drill down to specific areas, centre types or categories.
- Evaluate Centre Revenues and Footfall across different time periods to prioritise new site acquisitions or assess why some of your sites differ in performance.
See the images below to see what the RetailVision Reporting Dashboard Tool looks like:
To find out more about the RetailVision Dashboard Tool visit RetailVision, or read an example of how we used the Dashboard last month in our blog: ‘Considering the Potential Pending Sale of Health & Beauty Retailer Boots Using GMAP’s RetailVision Data’.
If you would like to combine your data to RetailVision within a Dashboard, this is something we could support you with. To find out more get in touch at info@gmap.com.
Get In Touch
If you would like to find out more about how GMAP’s Reporting
Dashboard capabilities could be used to enhance your data, or to learn more about the Used Car Report or RetailVision Dashboard Tools, please get in touch at info@gmap.com.