

RetailVision Retail Location Intelligence
RetailVision Retail Location Intelligence
A comprehensive depiction of the retail landscape and demographic data visualisation to enable smarter location decisions
Contact GMAP Today
RetailVision - International
RetailVision Points
A
competitively priced retail locations database to help you benchmark competitor and affinity brands.
RetailVision Destinations
RetailVision Points are aggregated to provide a detailed
illustration of the retail landscape &
Opportunity Scores facilitate 'next best' retail location analysis.
Applications
- Objectively support business decisions and site feasibility assessments.
- Develop comprehensive estate strategies, such as tactics for expansion or rationalisation.
- Monitor market share performance and benchmark competitor brands.
Why RetailVision?
- RetailVision can be delivered as a standalone retail location database, as a dashboard tool within Microsoft Power BI, or can be further brought to life through our mapping tool, MVPLUS.
RetailVision - UK
RetailVision Points
A
competitively priced retail locations database with coverage of over
80,000 stores, for over 800 brands, across the UK.
RetailVision Destinations
A detailed
illustration of the UK’s retail landscape
with approximately
21,000 Retail Centres, combined into
13,000 Trade Zones and further grouped into
800 Super Trade Zones.
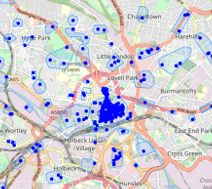
RetailVision Points
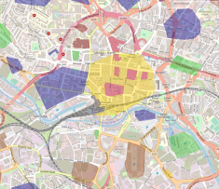
Retail Centres (by Type)
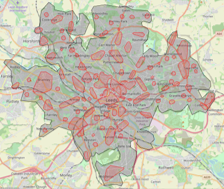
Trade Zones (Red)
& Super Trade Zones (Grey)
Insights from RetailVision
80,000+ Retail Points for 800+ Brands
Retail Destinations
20,000+ Retail Centres
13,000+ Trade Zones
800+ Super Trade Zones
14 Centre Types
Shopping Centres, Retail Park, etc.
5 Centre Segmentations
Premium, Mass+, Mass, Value+, Value
Features
- Our comprehensive RetailVision Points dataset identifies the geographical coverage of retailers across 27 categories (e.g. Bakery, C-Store, DIY, Fashion, Supermarket, etc). These are clustered to create RetailVision Destinations.
- RetailVision Destinations area hierarchical geography containing: Retail Centres (c.20,000), Trade Zones (c.13,000) and Super Trade Zones (c.800).
- Each RetailVision Destination is classified by Type (e.g. Arcade, Retail Park, etc.).
- RetailVision Points and Destinations are segmented into 5 categories: Premium, Mass+, Mass, Value+, and Value. This ensures a comparative evaluation across Destinations on both the Quality and Quantity of the retail provision.
- GMAP’s retail location intelligence model simulates the Bricks & Mortar Spend in each store across the 4 product types of:

- The Store Revenues are then aggregated into Retail Destination Spend
and an associated Retail Destination Ranking
is calculated.
- Quarterly Geo-Mobility Footfall Indexes to understand the dynamics of the market.
- Centre Footfall Catchments show the distance travelled and the catchment population.
Applications
- Objectively support business decisions and site feasibility assessments.
- Quantify and rank the size of the revenue opportunity for any UK Retail Centre, Trade Zone or Super Trade Zone.
- Develop comprehensive estate strategies, such as tactics for expansion or rationalisation.
- Monitor market share performance and benchmark competitor brands.
- Catchment analysis to understand from where shopper spend flows originate.
Why RetailVision?
- RetailVision can be delivered as a standalone database, as a dashboard tool within Microsoft Power BI, or can be further brought to life through our mapping tool, MVPLUS.
- The RetailVision Points dataset is initially derived from PAF, Royal Mail’s most accurate and up-to-date address database.
- The RetailVision methodology has been enhanced to account for the impacts of COVID using Geo-Mobility data and ONS retail sales data.
- Quarterly updates.
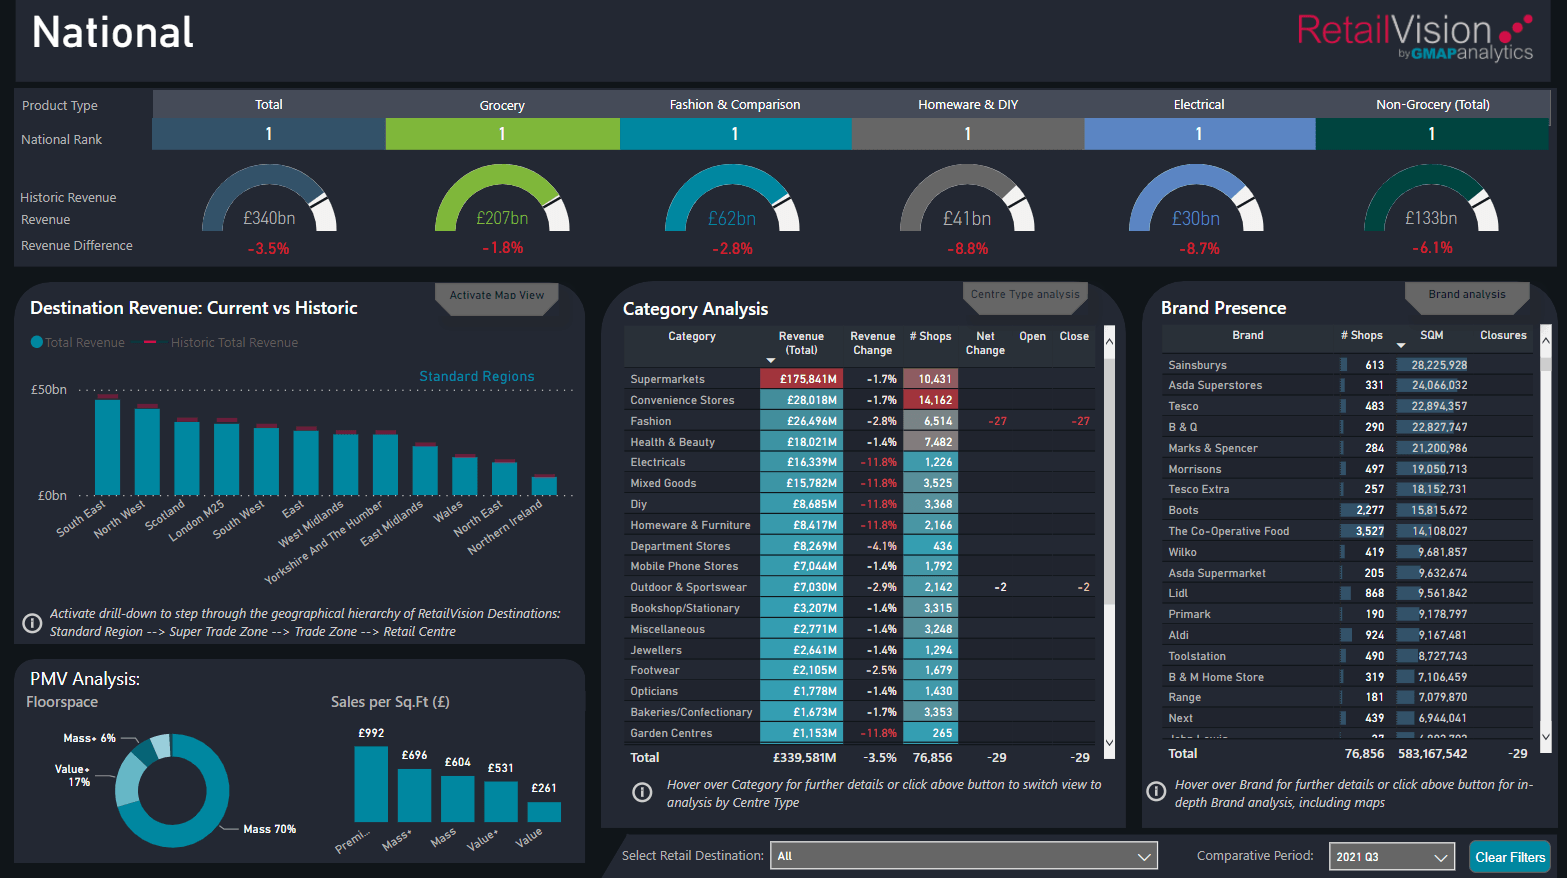
RetailVision Dashboard Tool
Our RetailVision Dashboard Tool
visualises,
reports and
consolidates the different RetailVision layers including RetailVision Points, our retail locations database, and our Retail Centre, Trade Zone and Super Trade Zone RetailVision Destinations.
Slide title
Write your caption hereButton
Slide title
Write your caption hereButton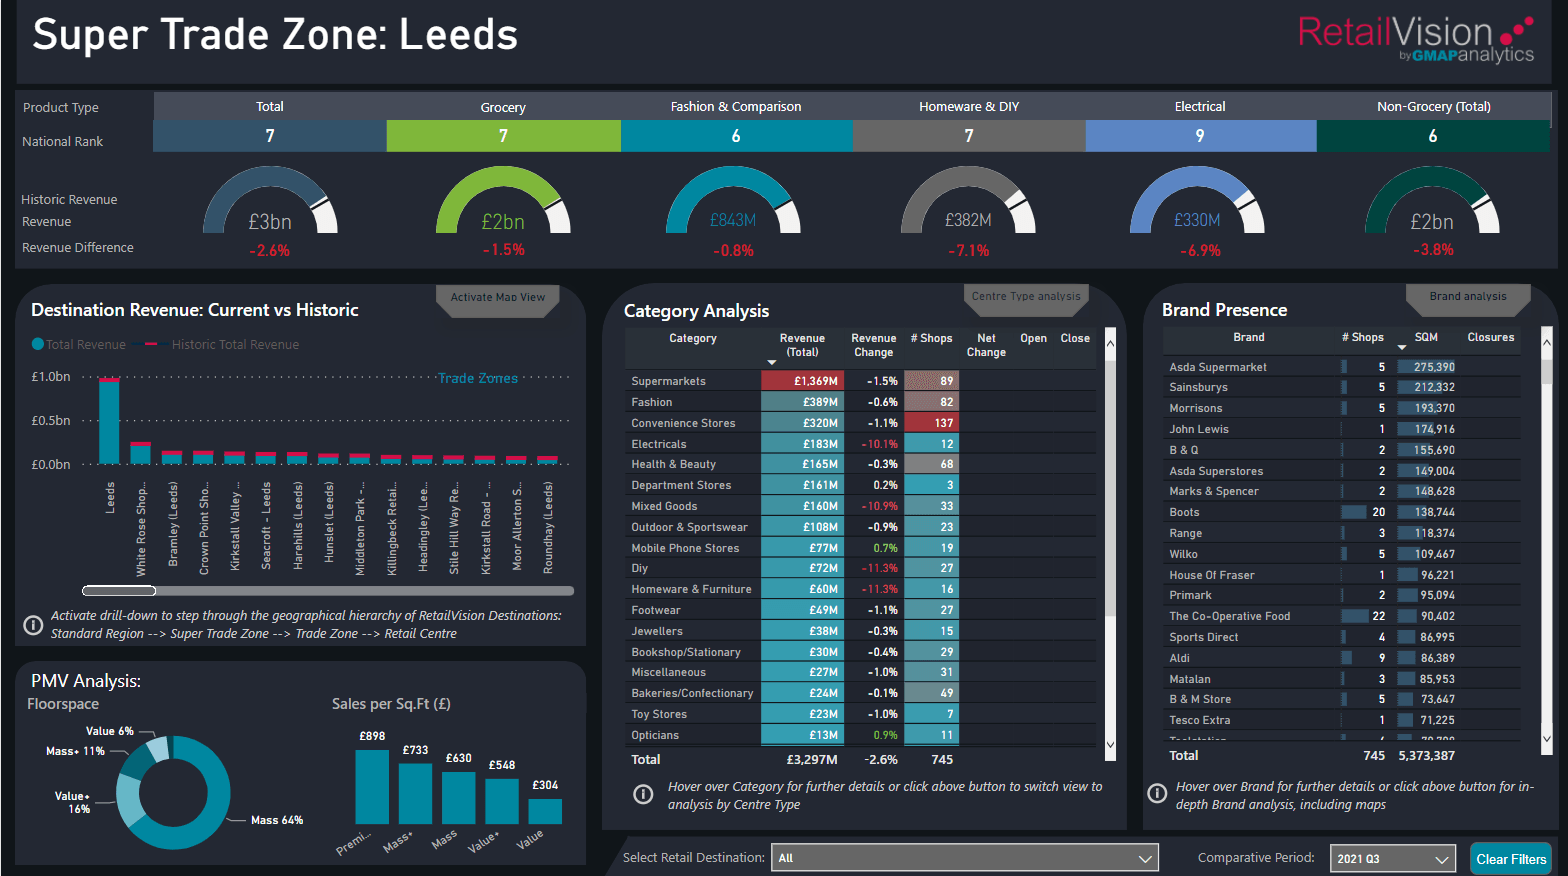
Slide title
Write your caption hereButton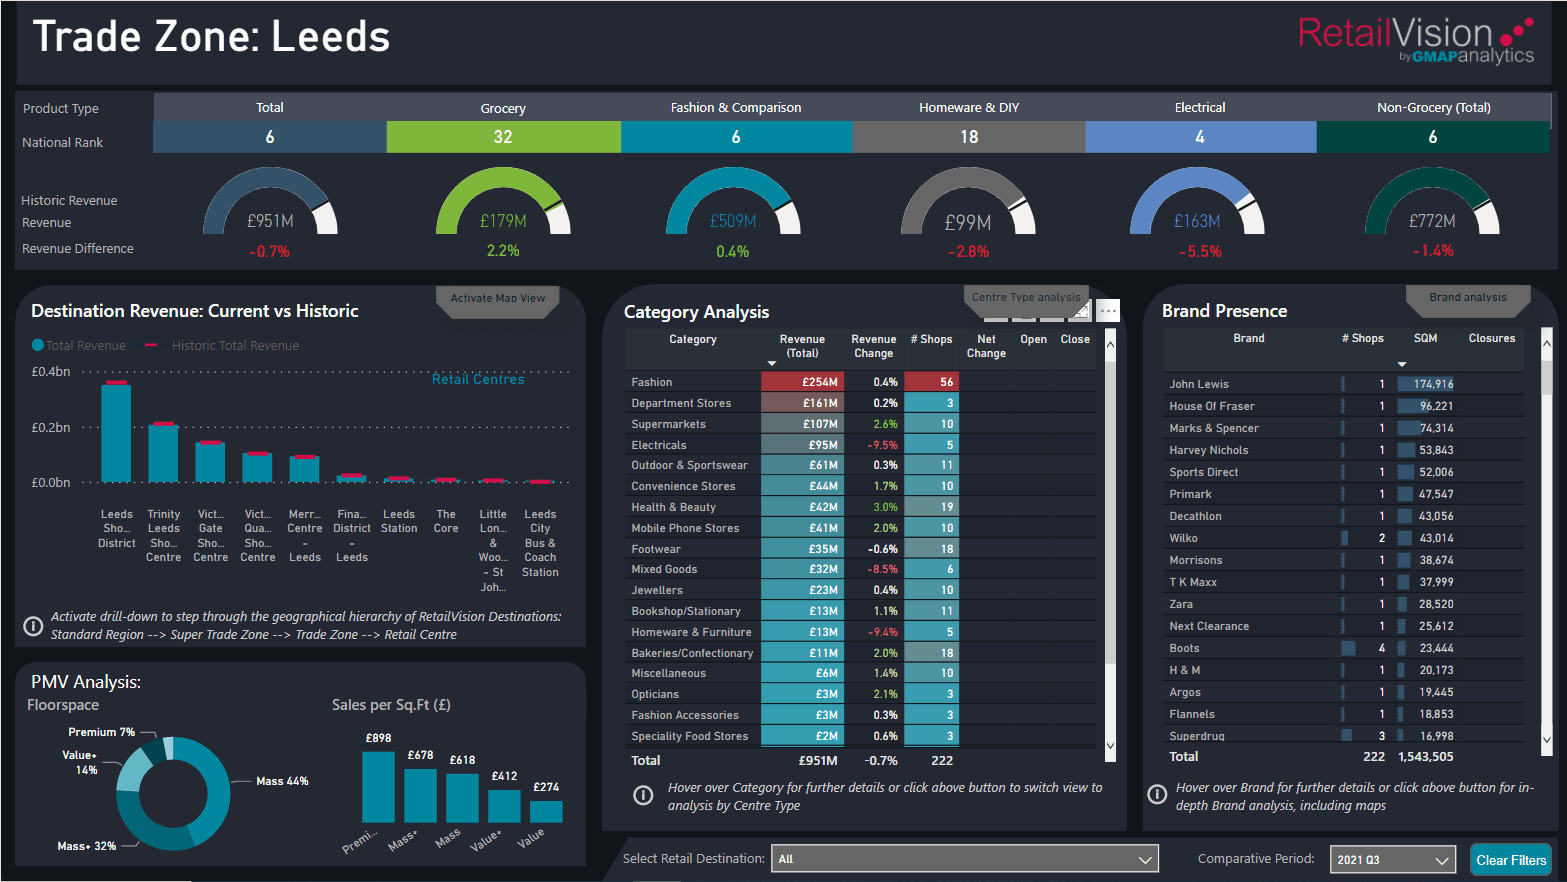
Slide title
Write your caption hereButton
Slide title
Write your caption hereButton
Case Study

RetailVision - International
RetailVision Points
A competitively priced retail locations database to help you benchmark competitor and affinity brands.
RetailVision Destinations
RetailVision Points are aggregated to provide a detailed illustration of the retail landscape & Opportunity Scores facilitate 'next best' retail location analysis.
Applications
- Objectively support business decisions and site feasibility assessments.
- Develop comprehensive estate strategies, such as tactics for expansion or rationalisation.
- Monitor market share performance and benchmark competitor brands.
Why RetailVision?
RetailVision can be delivered as a
standalone retail location database, as a
dashboard tool within Microsoft Power BI, or can be further brought to life through our mapping tool,
MVPLUS.
RetailVision - UK
RetailVision Points
A competitively priced retail locations database with coverage of over 80,000 stores, for over 800 brands, across the UK.
RetailVision Destinations
A detailed illustration of the UK’s retail landscape with approximately 21,000 Retail Centres, combined into 13,000 Trade Zones and further grouped into 800 Super Trade Zones.
RetailVision Points
Retail Centres (by Type)
Trade Zones (Red)
& Super Trade Zones (Grey)
Insight from RetailVision


Features
- Our comprehensive RetailVision Points dataset identifies the geographical coverage of retailers across 27 categories (e.g. Bakery, C-Store, DIY, Fashion, Supermarket, etc). These are clustered to create RetailVision Destinations.
- RetailVision Destinations area hierarchical geography containing: Retail Centres (c.20,000), Trade Zones (c.13,000) and Super Trade Zones (c.800).
- Each RetailVision Destination is classified by Type (e.g. Arcade, Retail Park, etc.).
- RetailVision Points and Destinations are segmented into 5 categories: Premium, Mass+, Mass, Value+, and Value. This ensures a comparative evaluation across Destinations on both the Quality and Quantity of the retail provision.
- GMAP’s retail location intelligence model simulates the Bricks & Mortar Spend in each store across the 4 product types of:


- The Store Revenues are then aggregated into Retail Destination Spend and an associated Retail Destination Ranking is calculated.
- High quality Geo-Mobility Footfall Data is utilised to inform temporal market dynamics on a quarterly cycle.
- RetailVision also includes: a Footfall Index and Catchment Range Decile Factors.
Applications
- Objectively support business decisions and site feasibility assessments.
- Quantify and rank the size of the revenue opportunity for any UK Retail Centre, Trade Zone or Super Trade Zone.
- Develop comprehensive estate strategies, such as tactics for expansion or rationalisation.
- Monitor market share performance and benchmark competitor brands.
- Catchment analysis to understand from where shopper spend flows originate.
Why RetailVision?
- RetailVision can be delivered as a standalone database, as a dashboard tool within Microsoft Power BI, or can be further brought to life through our mapping tool, MVPLUS.
- The RetailVision Points dataset is initially derived from PAF, Royal Mail’s most accurate and up-to-date address database.
- The RetailVision methodology has been enhanced to account for the impacts of COVID using Geo-Mobility data and ONS retail sales data.
- Quarterly updates.
RetailVision Dashboard Tool
Our
RetailVision
Dashboard Tool
visualises,
reports
and
consolidates
the different RetailVision layers including RetailVision Points, our retail locations database, and our Retail Centre, Trade Zone and Super Trade Zone RetailVision Destinations
-
Slide title
Write your caption hereButton -
Slide title
Write your caption hereButton -
Slide title
Write your caption hereButton -
Slide title
Write your caption hereButton -
Slide title
Write your caption hereButton
Case Study