

Providing Location Intelligence with Hexagonal Geographies
13th September 2023

Exploring Hexagonal Geography
In the past 5 years, Hexagonal Geography, known as H3, has been the newer and exciting way to visualise data both on maps and in charts in the world of locational intelligence and location planning. However the concept of hexagonal mapping goes back over 100 years!
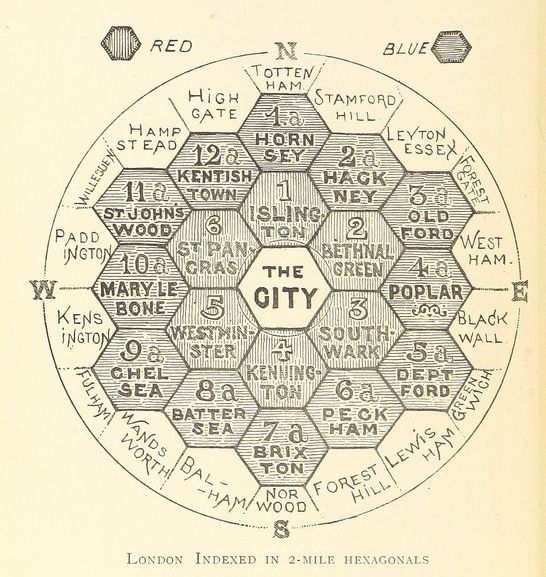
The map to the right is taken from a book
“The Unification of London: The Need and the Remedy” written by John Leighton and published in 1895 and shows how hexagons can be used to depict groupings of locations for better visualisation.
Here at GMAP Analytics we’ve been exploring the use of hexagonal geography for several years. We have used it in a number of projects and products, either as a way to deliver data to clients in MVPLUS
or in order to incorporate data into our projects. For example, we use the hexagonal geographies as part of our LeisureVision
Destinations product.
What is Hexagonal Geography?
H3 geometries were created and expanded by Uber
in 2018. H3 is Uber’s Hexagonal Hierarchical Spatial Index or grid-system with global coverage, designed as a flexible and hierarchical set of units to be utilized in multiple locations for the aggregation of mass point data. Uber used it for the aggregation of GPS tracks from their location tracking of their vehicles to optimise their business strategy by the use of dynamic location-based pricing and servicing.
H3 allows for this optimisation to occur at an efficient and affordable rate, as instead of analysing supply and demand at a fine granularity and the exact location, such as by road or street, Uber can analyse by area, and thus upscale this analysis globally at an affordable and sustainable rate.
Figure 2 depicts this process of bucketing; grouping locations and other geospatial manipulations into hexagons with hierarchical properties. The example in Figure 2.3 depicts the areas with higher density of vehicles in coral and lower density in blue.
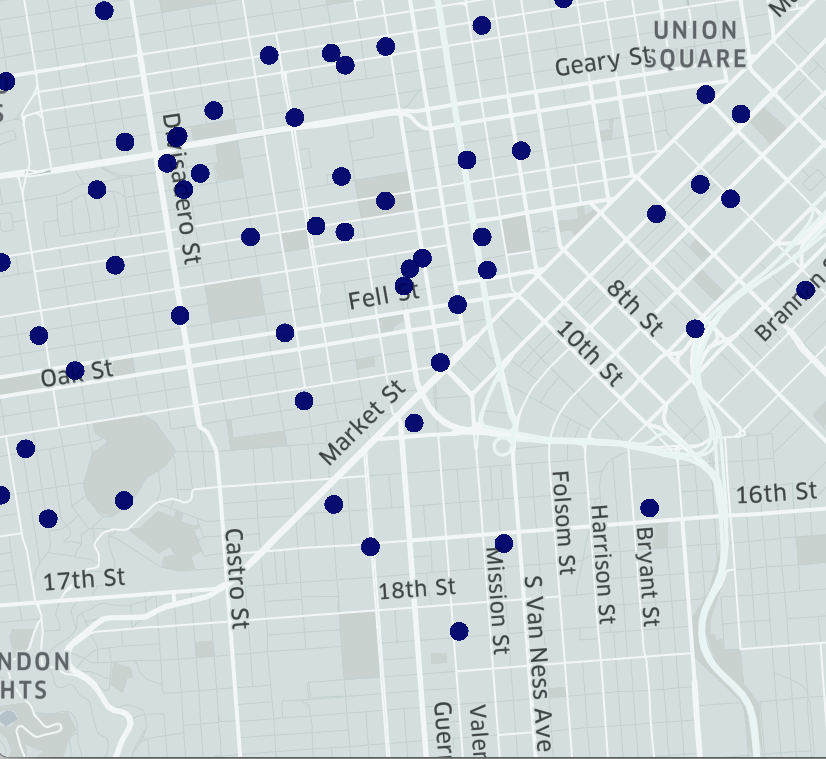
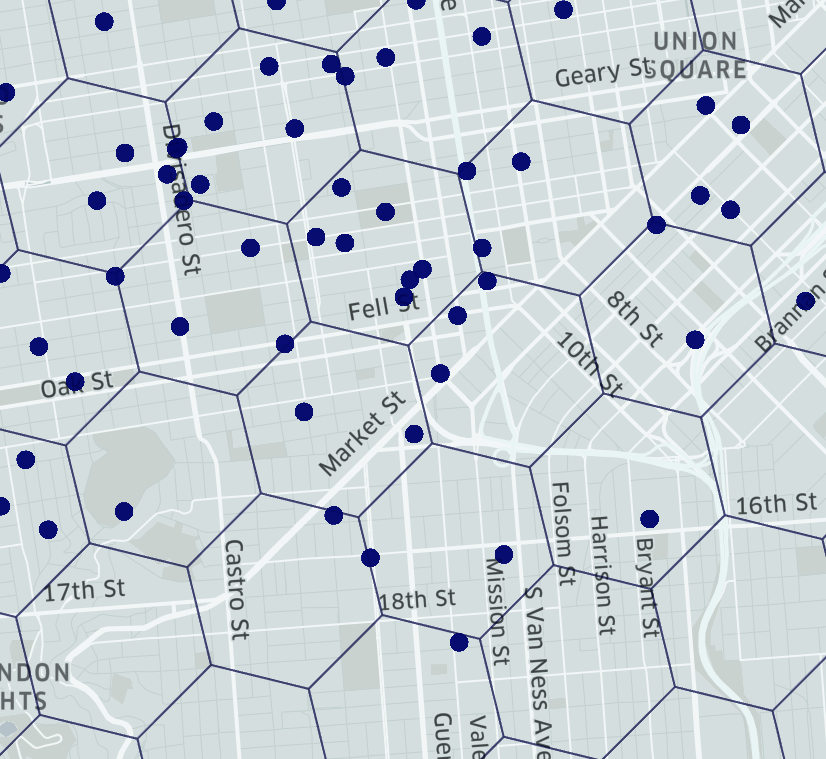
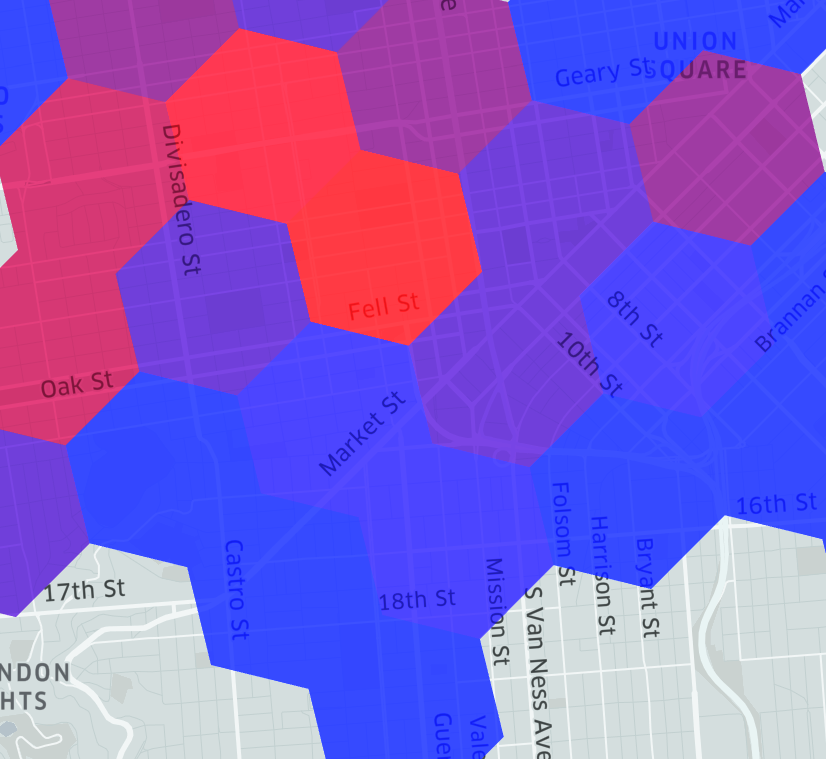
Figures 2.1 - 2.3: Process of bucketing points with H3, from Uber
H3 is a Discrete Global Grid System (DGGS), meaning it consists of a series of discrete global grids which have increasingly finer resolution grids, such as the sixteen different hexagonal grid-resolutions. The regular hierarchical relationships between DGGS resolutions create efficient data structures.
However, usual DGGS are based on the geographic coordinate system which is a square grid. These do not have equal area cell regions, making analysis complex as the cells become distorted into triangular shapes. Square grids require multiple sets of coefficients when used for analysis, because they have two different types of neighbours; the ones they share an edge with, and the others, a vertex, as shown in Figure 3. Hexagons have one distance between a hexagon centerpoint and its neighbours’, rather than 2 for squares and 3 for triangles. This simplifies analysis performance and gradients are smoother.
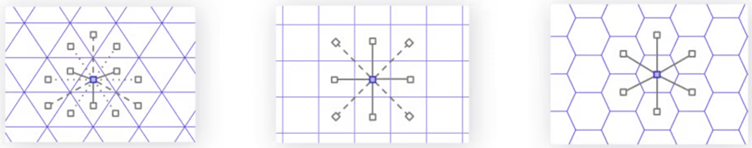
Figure 3.1- 3.3: Distances from a point to its neighbours on different projections
How is Hexagonal Geography useful for analysis?
Hexagonal Geography is a useful tool in providing location intelligence and in location
planning as enables geographical areas to be segmented and used for many aspects of analysis. For example, our location planning consultants
can analyse demographic or POI data within hexagon cells.. H3 allow for this analysis to occur at different resolutions. This creates powerful analysis and efficient working.
Hexagonal Geography reduces the issues of overlapping point data, which lessens visual distortion. For example, if there are three retail outlets on top of each other, the aggregation to a Hexagon prevents any being forgotten about. The regular hexagonal grids allows for us to store a mix of data. For example, physical attributes can be mixed with demographics, location details, and any other relevant data such as a Hexagon’s LeisureVision Opportunity score. This means we can compare a grid cell individually, or aggregated, to other areas, without limiting your analysis by area size.
One thing to note when using Hexagonal Geography is that it forces irregular shapes, roads, buildings, cities, into hexagonal grids. This can cause the “boundary effect”, making, for example, a population in a coastal area seem lower because the hexagon contains the ocean as well as the land. For this reason, it can be better to use lower resolution Hexagons or aggregate Hexagon clusters.
Hexagonal Geography at GMAP
Here at GMAP Analytics we recognise how useful Hexagonal Geography is for location planning and location analysis. We use Hexagonal Geographies for:
2. To build some of our Location Intelligence Data products3. To deliver data to our clients for use in MVPLUS or their inhouse systems
Hexagonal Geography in LeisureVision
Hexagonal Geographies are used in our LeisureVision
Product to create the LeisureVision Destinations. LeisureVision Points are mapped to the H3 Hexagons to allow clients to visualise the distribution of leisure activity in the locality. This can be used to see where there is future opportunity for relocation or new stores. LeisureVision is available within MVPLUS, our online mapping tool, or as a standalone dataset in any projection requested. LeisureVision comprises of data across four product categories: Food & Beverage, Entertainment, Competitive Socialising, and Sports & Fitness. The use of LeisureVision in MVPLUS allows clients to visualise the data alongside other datasets, as well as run catchment analysis on the data.

Conclusion
Hexagonal Geography helps us to create location intelligence and provide location planning solutions for our clients globally in a visually appealing and modern way. If you are interested in finding out more about GMAP’s use of hexagonal geography, our datasets that use Hexagonal Geography such as RetailVision
and LeisureVision or our location planning consultancy services - get in touch at info@gmap.com.