

Using RetailVision Footfall Data to Explore Covid Shopping Behaviours in Yorkshire & The Humber
23rd November 2021

How did Covid, imposed restrictions, and lockdowns, really influence our shopping behaviours?
This is a question the GMAP team, and our clients have been eager to understand.
Top level headlines can tell us the overall trends such as the boost to online sales, and the successes in the DIY and Grocery sectors, but we wanted to explore what really happened on the ground and understand the micro level impacts and trends which impacted, and continue to impact, our clients.
This is a challenge we set to one of our University of Leeds Geography placement students, who we worked with to extract detailed Centre-level information from our re-vamped RetailVision dataset for Yorkshire and the Humber.

RetailVision Bringing Footfall Data to Life
RetailVision has recently been transformed to include Centre-level geo-mobility footfall data
to capture the temporal market dynamics, and it was quick to see that some interesting trends were evident across the Centres, when comparing rates of footfall during pre-Covid to Covid time periods.
The Big Lockdown Day Out, to the Retail Park
Unsurprisingly, the largest positive change in footfall was found at an accessible, parking friendly location, Birstall Shopping Park, which is also anchored by an IKEA. A trend also found at Drakehouse Retail Park, a retail park with similar retailers, just on the outskirts of Sheffield and Gatepark on the outskirts of Rotherham.
Figure 1: Did IKEA drive footfall to Birstall Shopping Park in Leeds?

The Rise of the Suburban Shopping Districts
Interestingly, there was also a large positive change in footfall in some of the smaller shopping districts in Yorkshire, such as Castleford, Heckmondwike and Barnsley. A sharp contrast to their larger counterparts, who were the RetailVision Centres with the largest negative footfall change, Leeds, Sheffield, and York shopping districts. The ‘Shopping District’ Centres experienced distinctive footfall rates which were dependant on their location type, with clear trends of suburban ‘Shopping Districts’ gaining growth in footfall, compared to the ‘Shopping Districts’ in large urban areas and CBDs who saw negative change.
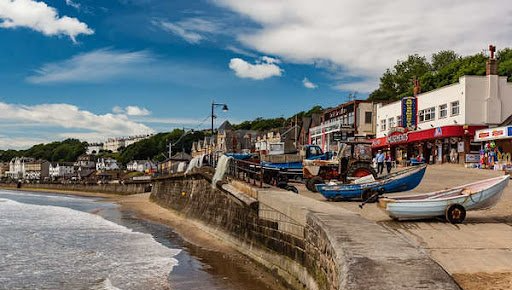
We Did Like to Be Beside the Seaside
The analysis also considered the distance people travelled during pre-Covid to Covid time periods, and once again found strong consumer trends which supported the theories that the ‘work from home’ guidance and restrictions kept people away from the urban areas, and when they did travel the coastal areas saw the greatest traffic, as we all remember from the pictures of swarms of people crowding beaches. Coastal RetailVision Centres saw the greatest increase in average distance travelled, with Murray Street in Filey seeing the biggest increase. Whereas many key business industrial estates, and the motorway service stations and transport hubs that serve the key cities saw the greatest declines in distance travelled.
Figure 2: Murray Street, Filey
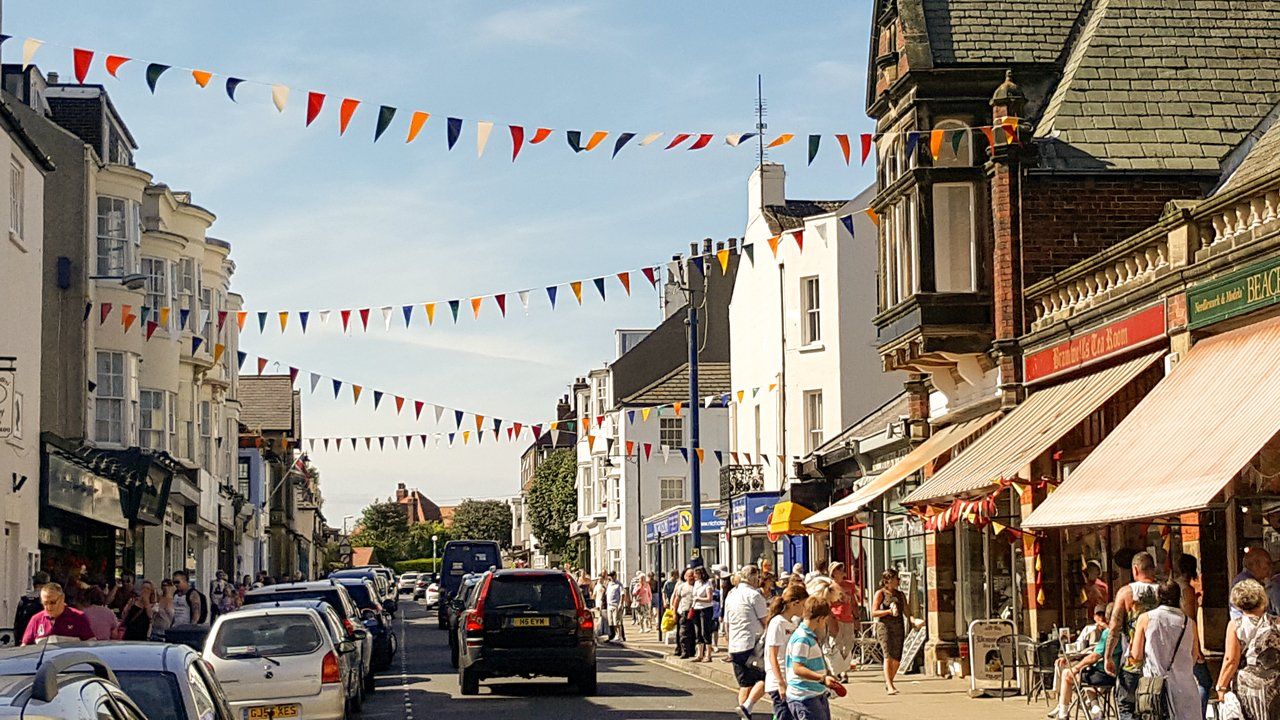
Figure 3: Filey seafront
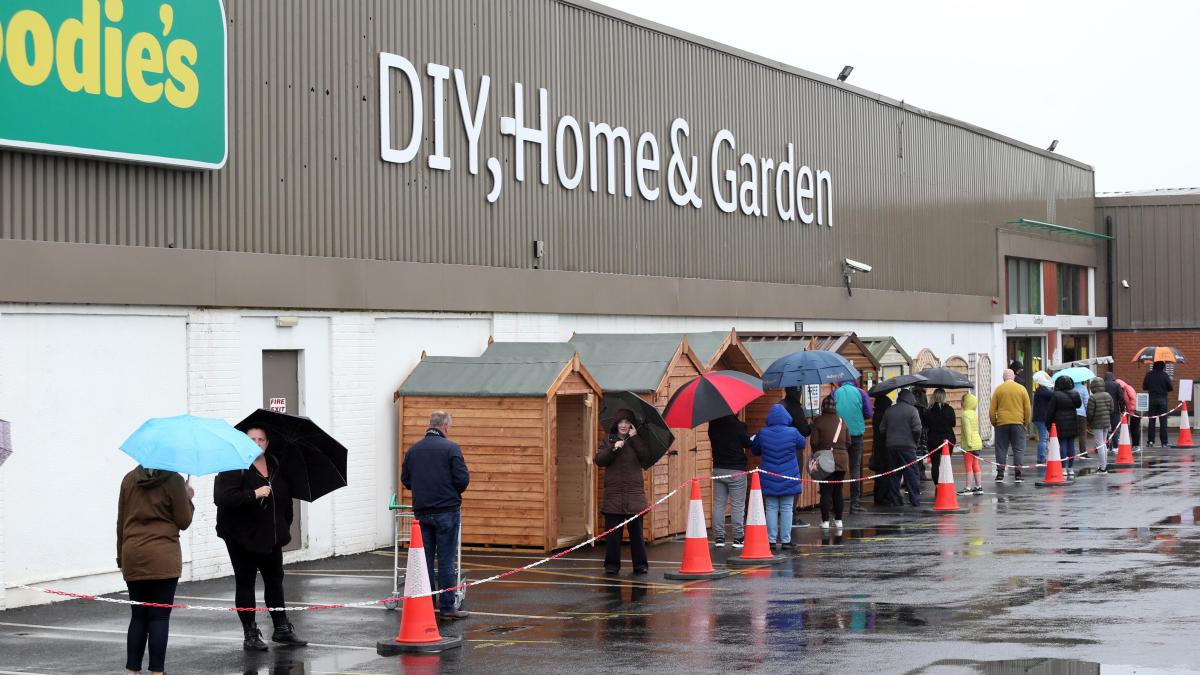
Building Foundations Over Wearing Foundation
The Centre product mix of the Centres most significantly impacted by footfall change supports the reports that consumers were much more actively visiting Centres anchored by homeware and DIY, garden centres, convenience, and supermarkets, whereas the Centres with the largest negative change in footfall were, on average, around 40% fashion and beauty stores.
Figure 4: Increase in popularity in Homeware, DIY and Garden Centres
RetailVision Insights of the Shopping Behaviours in Yorkshire & The Humber
GMAP’s RetailVision data indicates real strong trends of consumer behaviour as a result of Covid, behaviours previously speculated but not evidenced. Using real devise mobility data measured at RetailVision Centres level allows accurate comparisons and conclusions to be drawn.
RetailVision confirmed the notion that Covid resulted in the people of Yorkshire focusing their spend in specific areas, notably away from Fashion, probably because who cares what you’re wearing if you have nowhere to go? While shoppers also actively avoided enclosed spaces, such shopping malls, favouring out-of-town retail parks for their DIY and grocery needs. Whereas the working from home guidance manifested in an increase in very localised shopping habits. Yet, lockdowns and restrictions also resulted in consumers taking to the coast when they did feel the need to escape home, creating patterns and levels of footfall not seen pre-pandemic.
How Can I Find Out More?
To find out more please visit our RetailVision webpage, or get in touch at info@gmap.com