

Comparing 2019 to 2021 Vehicle Transactions – Covid-19 Impacts & Growth of Battery Electric Vehicles
15th February 2022

It’s no secret that the Automotive industry has seen a massive impact from COVID-19. With the country in lockdown for pro-longed periods, and working from home becoming the new norm, it’s safe to say that over the last 24 months we’ve been using our cars less than ever. At the same time, the country is becoming more environmentally conscious and with ICE (internal combustion engine) sales ceasing in the UK in 2030, BEV (battery electric vehicle) adoption is accelerating.
The question is, how is the BEV market changing in comparison to the wider new car market in this challenging climate? At GMAP we have used the latest DVLA new car registrations data
to investigate how the relative changes to the BEV market compared to the wider new car market.
Total New Car Transactions
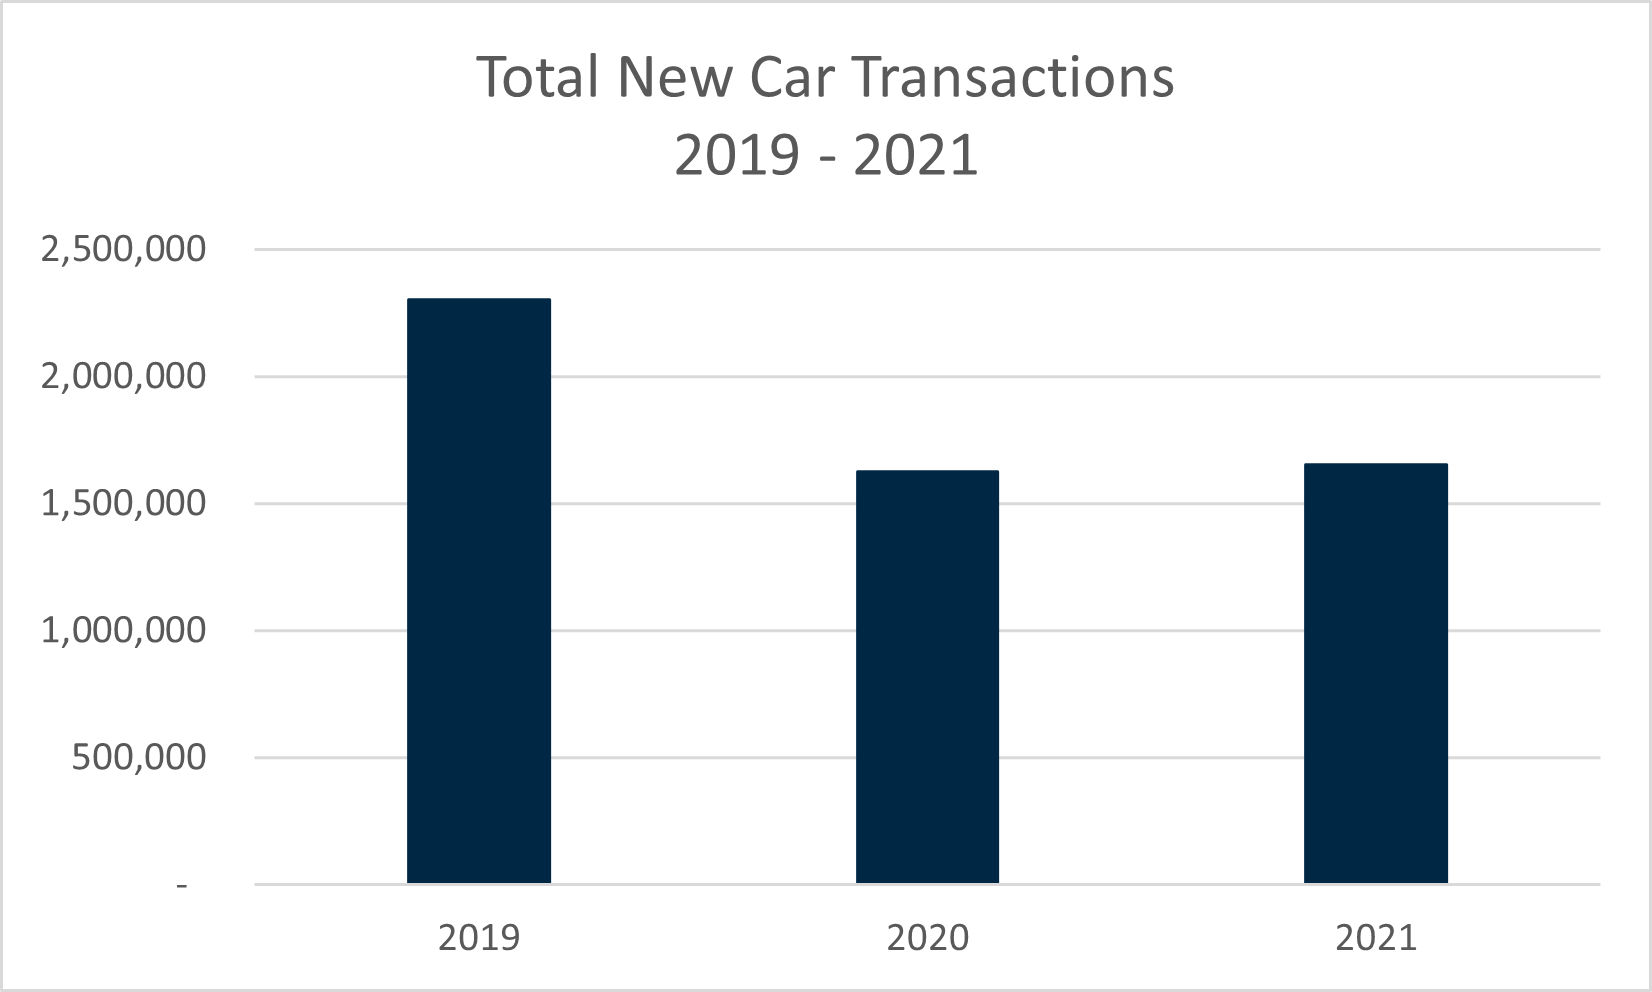
Using our DVLA new car transactions data we looked at three individual time periods: full year 2019, full year 2020, full year 2021. This was to assess a baseline value of the new car transactions market, the impact of COVID-19 on the new car market, and how the market was then recovering after the numerous challenges posed by COVID and Brexit.
Total new car transactions witnessed a sharp decline between 2019 and 2020, with the 2020 new car transaction total only reaching around 70% of the volume seen in 2019. This was inevitably driven by COVID-19 with a high proportion of 2020 being spent in a national lockdown. As the demand for new vehicles slowed, manufacturers started to scale back their operations and produce less vehicles. Not all manufacturers slowed production by choice, however. A shortage of vital components used in vehicle production caused factories and production lines to close for weeks at a time. This in turn, had a knock-on effect leading in to 2021.
New car transactions in 2021 painted a very similar picture to that seen in 2020. The market figures show a minimal recovery of just under 2% growth in 2021, compared to 2020. This is still bleak in comparison to the figures seen in 2019. Although this lack of recovery might be partly due to decreased demand from economic uncertainty caused by the pandemic and Brexit, a large portion is attributed to lack of supply from manufacturers.
Vehicle Supply Issues
It has been well documented that there is a global shortage of semiconductor chips. This has been caused by increased demand for consumer electronics (laptops, smartphones, tablets etc.), coupled with decreased production due to closures of factories and supply chains. These chips are vital in the production of new vehicles and whilst vehicle manufactures have taken steps to mitigate this problem, it is estimated that the semi-conductor shortage may impact automotive products throughout 2022, and possibly into 2023.
Used Car Transactions
One consequence of these supply chain issues constraining new car supply has been the knock-on effect to used car prices. As new vehicles have faced production issues, the demand for used vehicles has increased, leading to inflated used car prices throughout 2021. Online used car marketplace, CarGurus, stated that the price of their most popular used car models rose by over 26% between January 2021 and January 2022. It has been reported that used car sales are increasing over 4 times faster than used car stock levels. With demand outpacing supply at such a high rate there is no surprise that used car prices are on the rise. This increase is projected to last into the later months of 2022.
With this increase in used car prices in mind, GMAP investigated the used car transactions data for vehicles aged up to 10 years, using the same three time periods mentioned previously.
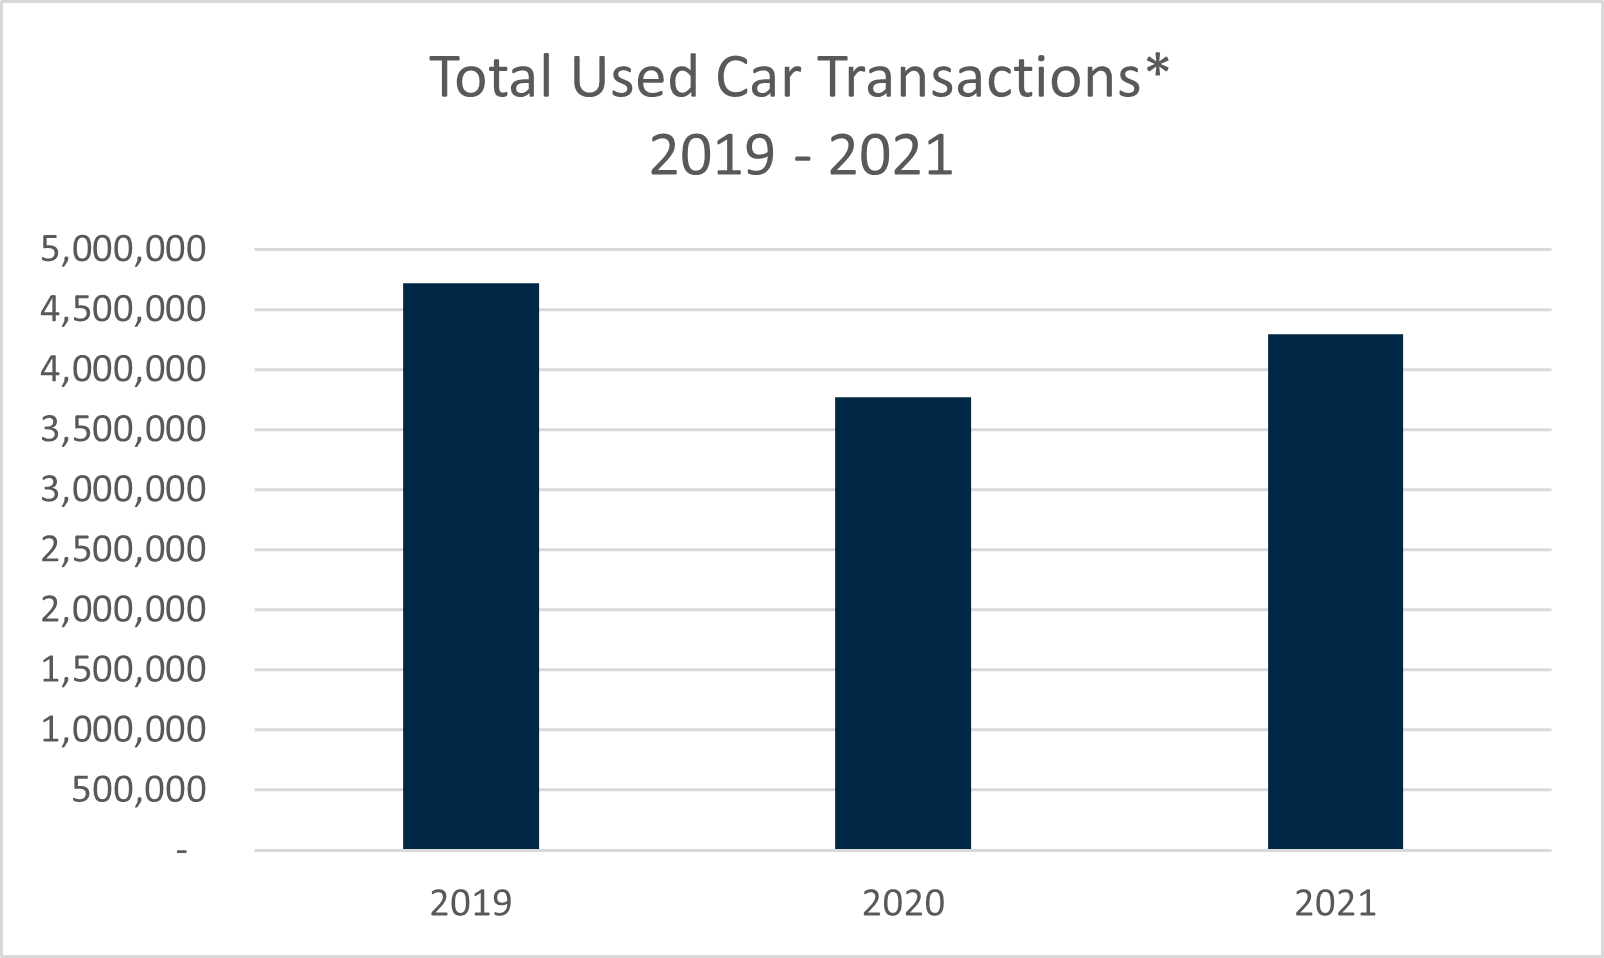
*Vehicles up to 10 years old
Total used car transactions declined between 2019 and 2020, with the 2020 volume reaching only 80% of the total 2019 volume. It is interesting to note that this decline is significantly lower than that seen in the new car transactions market which potentially further highlights the production issues faced from COVID-19. Whilst total new car transactions witnessed a minimal increase between 2020 and 2021, used car transactions had a much larger rebound. Our data shows that used car transactions for vehicles up to 10 years old increased by almost 14% in 2021 compared to 2020. Whilst the figure for vehicles in this age band is still below the 2019 volume, transactions have shown a significant increase despite the inflated vehicle price. It will be interesting to see how the used car market changes as new vehicle production returns to pre-COVID levels.
ICE vs BEV:
We have discussed the total new car market, but how has the BEV market fared in comparison? BEV market performance is a stark contrast to the rest of the automotive market. Our data shows that despite the current challenges, the BEV market has consistently grown, and quickly! In 2019, new BEV transactions made up less than 2% of the total new transaction market. In 2020 this grew to over 6% and in 2021 it almost doubled its share to form over 11% of the total new car transactions. In contrast, non-BEV vehicles are showing a steady downward trend.
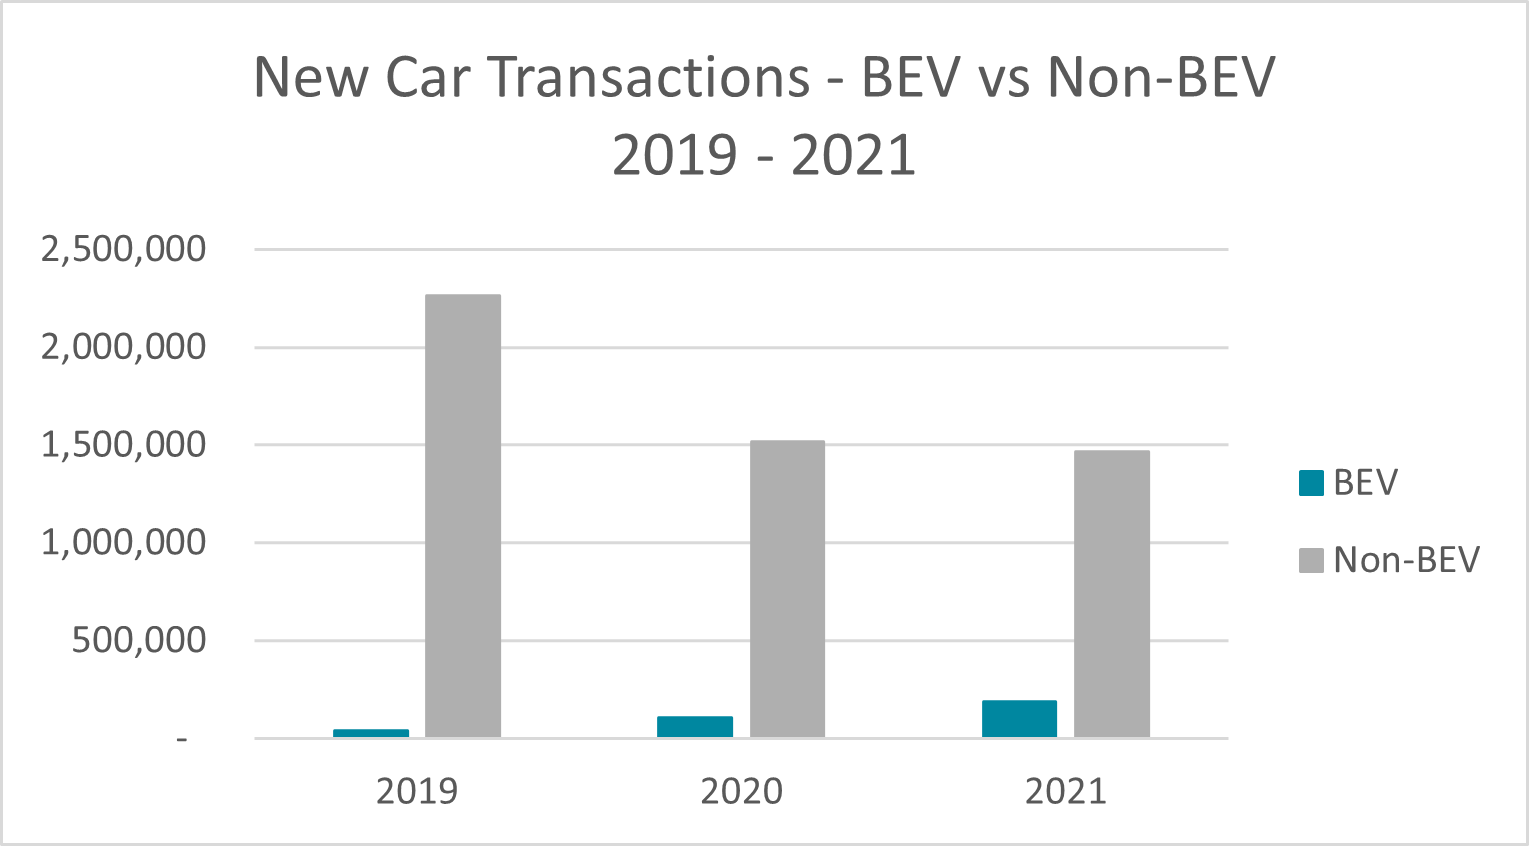
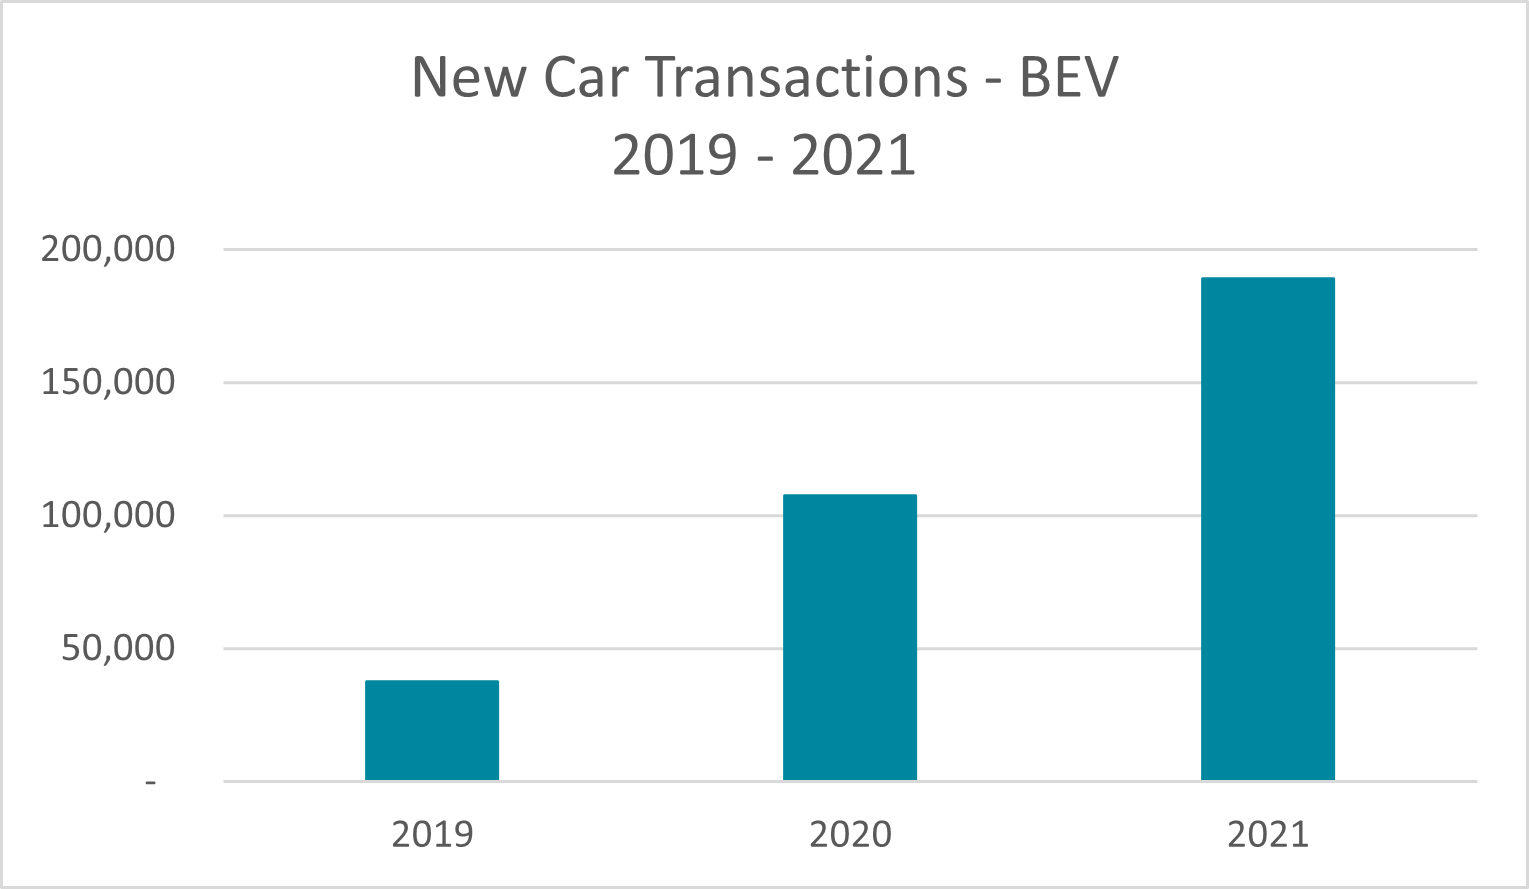
The total non-BEV new car transactions in 2020 was only around 67% of the volume compared to that in 2019. In 2021 this decreased further, albeit at a much slower rate, to around 65% of the volume compared to 2019. The growth of the BEV new transactions market is staggering with over a 5-fold increase from 2019 to 2021. This seemingly played a vital role in the market growth from 2020 to 2021. Whilst the number of non-BEV new transactions reduced from 2020 to 2021, the large growth from BEV caused the total market to increase in this same period. Without the growth of pure electric vehicles, we would have likely witnessed a further decline in the number of total new car transactions.
Why are BEV’s becoming more popular?
Buying a new car is a large purchase; for most people it will be the second largest purchase after a house. BEV’s are notoriously expensive since they are still relatively new technology and are in their infancy, when compared with traditional ICE vehicles. That said, the price of BEV’s is reducing, making them more accessible. Cheaper running costs and servicing (as after all, they have far fewer parts), coupled with improved battery technology is making BEV’s a more attractive proposition. Range anxiety is becoming less of a concern thanks to rapid charging technology and a wider network of charging infrastructure. These developments, coupled with the 2030 legislation, should provide the platform for an exponential increase in BEV adoption in the UK.
The key question is, how fast will the BEV market grow under less turbulent conditions?
Get In Touch
If you would like to learn more about our DVLA vehicle registrations data
products and how they can add value to your organisation, then please get in touch at info@gmap.com.