

Considering the Potential Pending Sale of Health & Beauty Retailer Boots Using GMAP’s RetailVision Data
2nd March 2022

Last week was the deadline for indicative bids for Boots, which is currently owned by Walgreens Boots Alliance. There has been much speculation as to who will take over the renowned British institution, and its 2,200 stores. The billionaire Issa brothers behind the EG Group are amongst those rumoured to be key contenders, with a takeover worth up to £10bn.
Euro Garages started as one forecourt and has grown into the EG Group. In recent years, the EG Group has seen exponential growth with the acquisition of several major UK brands. The EG Group, with the backing of TDR Capital, purchased Asda for £6.8 billion in 2020. A few months later they acquired fast food chain Leon Restaurants for £100m and Cooplands (CS Food Group Holdings) within the same year. It is thought that the acquisition of Boots would have huge opportunity for integration within Asda stores.
Boots is a British household name, which was founded in Nottingham in 1849 and remains head quartered in Nottinghamshire. We have looked at the latest version of our RetailVision dataset
to evaluate the current position Boots holds in the UK Health & Beauty retail landscape.
Health & Beauty
The Health & Beauty category has an estimated total in-store spend of £18 billion across major retailers annually. Overall, throughout the pandemic Health & Beauty was one of the few categories which experienced growth. The year-on-year revenue spend on Health & Beauty increased by 10.6%. This was likely exacerbated further by the fact that pharmacies, which account for many of the key brands in the Health & Beauty retail category, were classed as “essential retail” so remained open. Throughout Covid self-care and well-being became the focus for many of us, as people had more time of their hands and spending more time at home during a health crisis, which could have also been a contributing factor to the increase in Health & Beauty revenue spend.
Spend on Health & Beauty was 1.4% less in Q4 2021 than Q3 2021. This could have been due to multiple factors, including the fact that Q3 was the first period since the pandemic began in which most Covid restrictions were lifted across the UK which enhanced consumer confidence. The emergence of the South African Omicron variant in late November meant that caution around Covid returned, and many shoppers chose to stay away from the retail hotspots throughout December to ensure they were safe to see their families at Christmas. Figure 1 reiterates this as there was a return to out-of-town retail. Retail Park spend increased by 2.3% whilst Shopping District and Street Centre Types observed decreases of 1.9% and 2.4% respectively. This corresponds with what was witnessed throughout the rest of the pandemic.
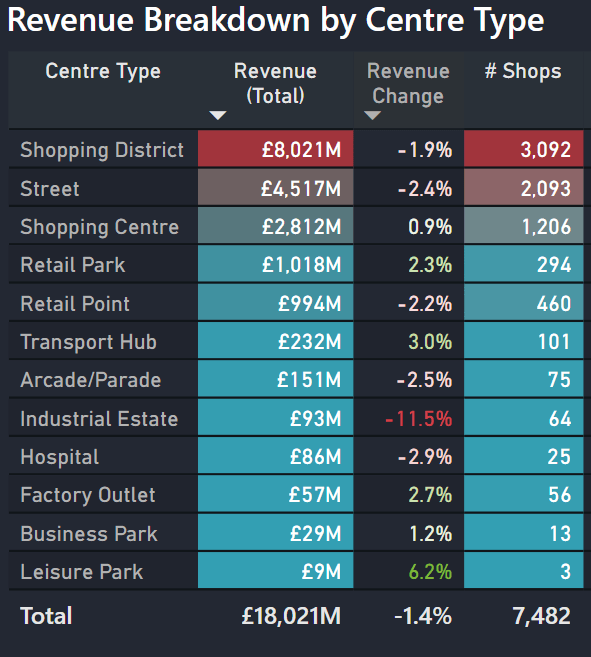
Figure 1
According to the RetailVision Points dataset, which contains retail location data for over 800 brands across the UK, there are approximately 7,500 stores nationwide across 37 brands, that occupy approximately 27,000,000 m² of retail floorspace. There is no question that Boots is the leading UK Health & Beauty retailer; as they account for around 30% of the total stores and occupy 60% of Health & Beauty floorspace (see Figure 2). Superdrug, the brand with the second highest total floorspace, has approximately 4 times less floorspace than Boots. In terms of store count, Lloyds Pharmacy and Well Pharmacy have the 2nd and 3rd highest number of stores, respectively. Lloyds have under half the number of outlets Boots does, whilst Well has less than a third.
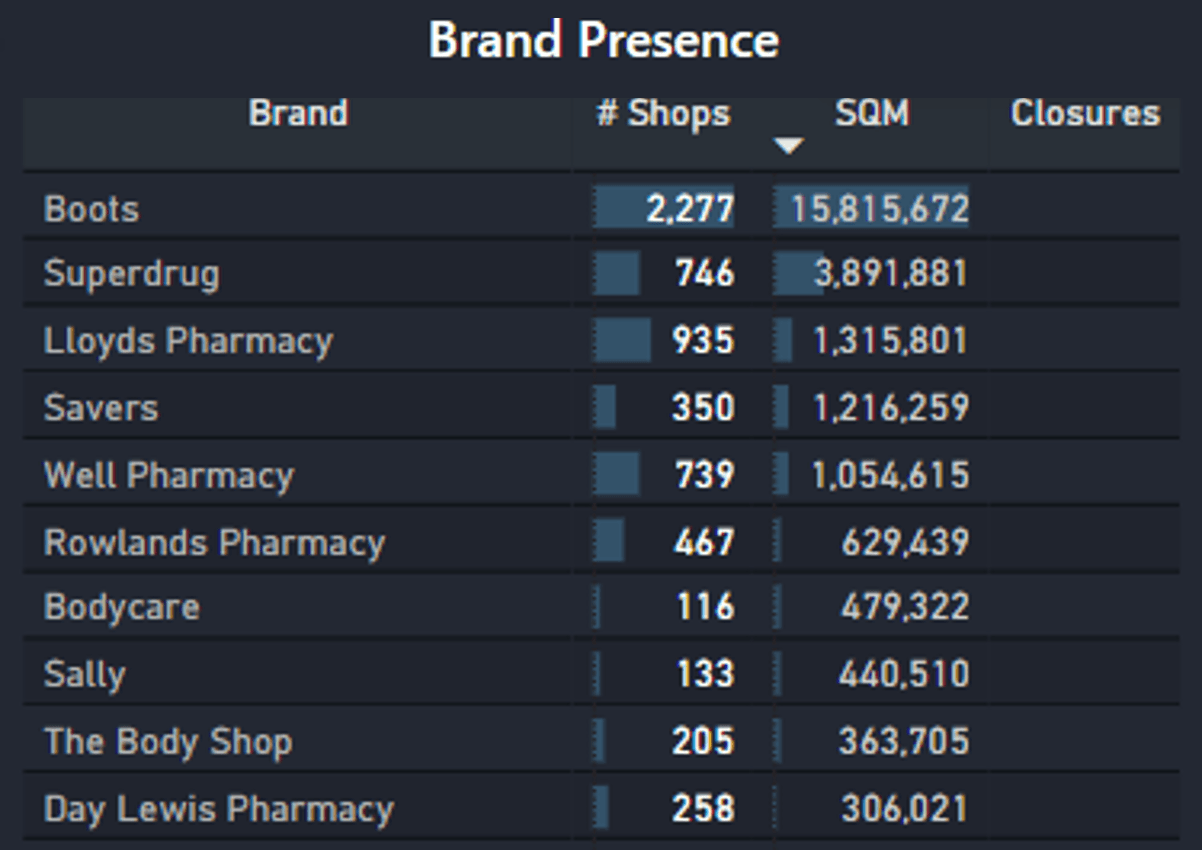
Figure 2
The Location Strategy
of Boots
If EG Group do acquire Boots, what would their location presence look like? From Figures 3 and 4, Boots over-index in Shopping Districts compared to the category average. 46% of Boots’ stores are in Shopping Districts compared to 27% of their competitors. However, Boots under-index in Retail Parks which is interestingly one of the Centre Type’s which has been experiencing growth throughout the pandemic, as established in Figure 3.
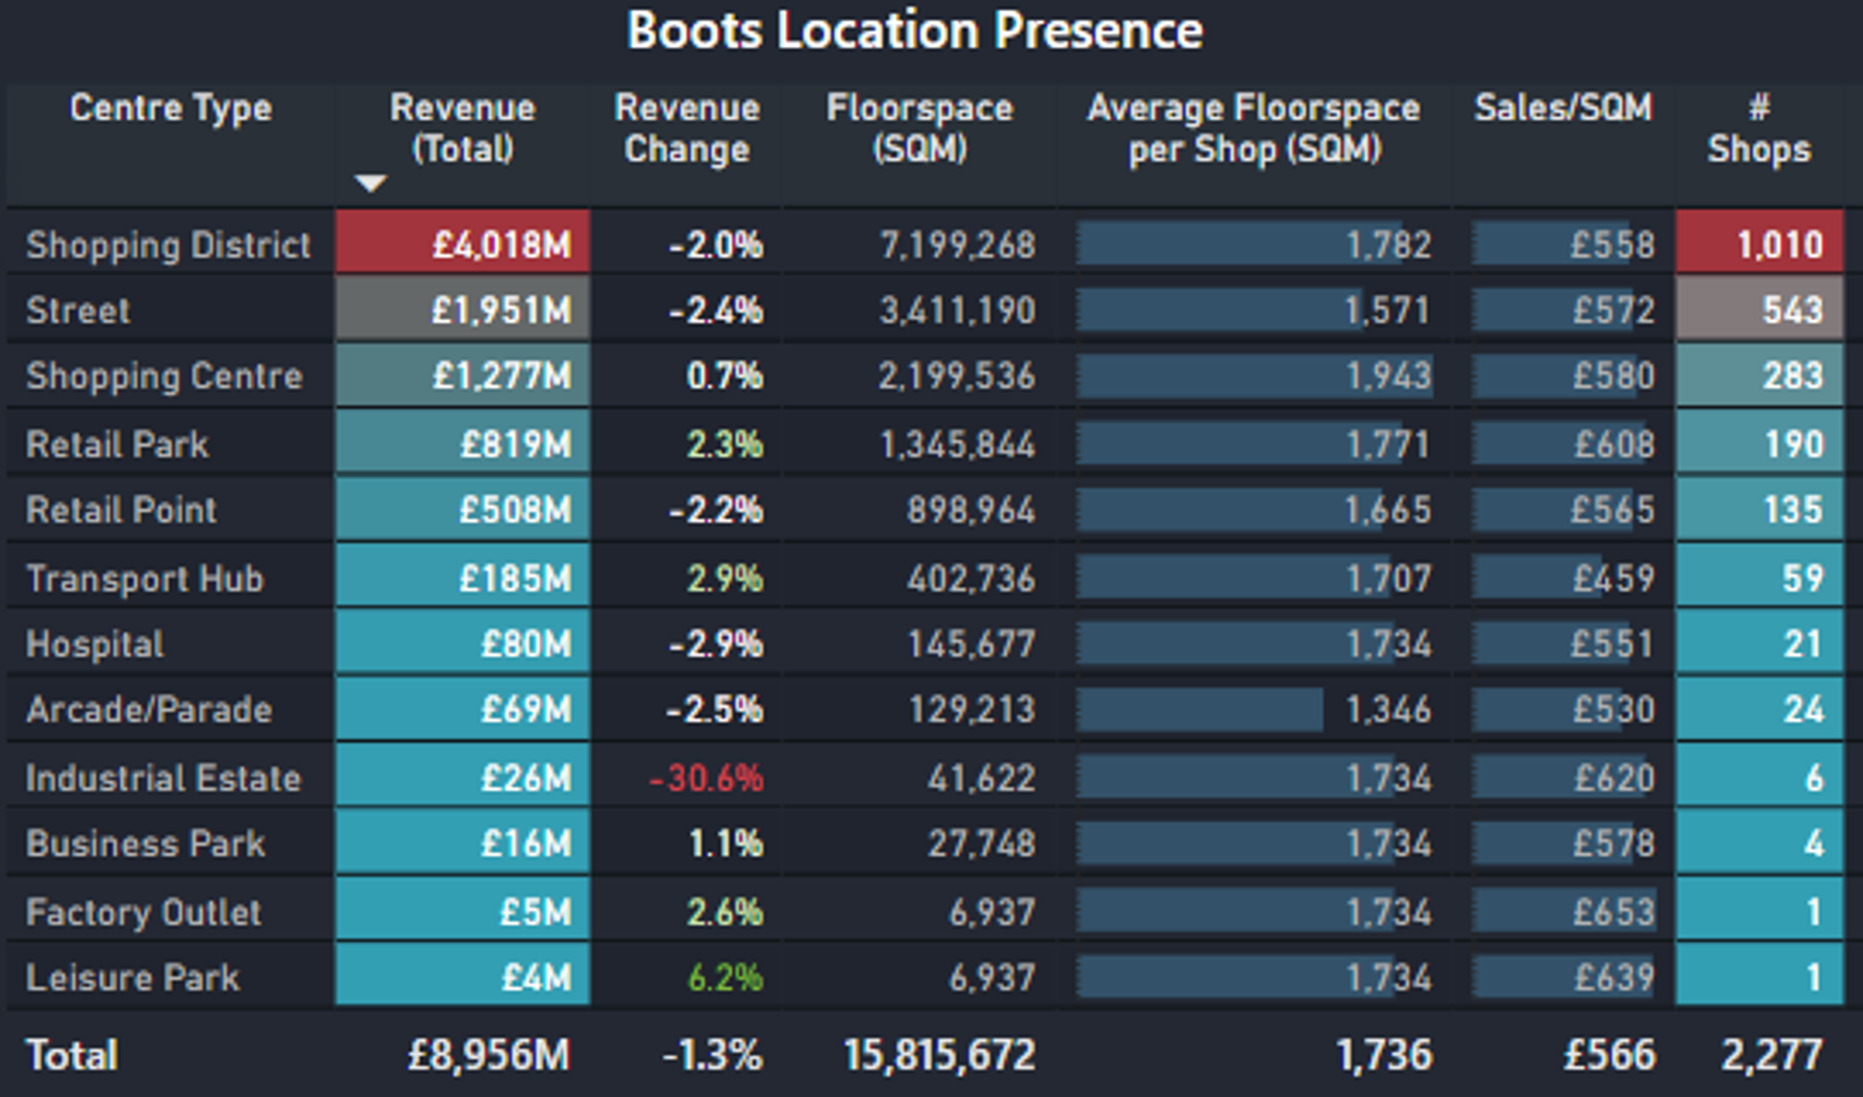
Figure 3
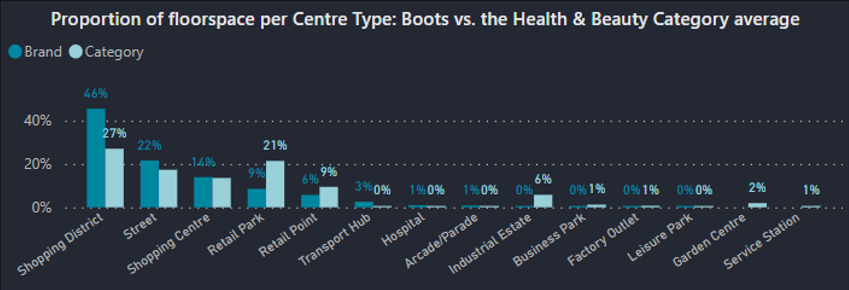
Figure 4
Looking at Figure 5, demonstrates the location strategy and store size by region, by looking at the count of stores by region and average floorspace. There is a clear regional variation. Whilst, unsurprisingly, London has the highest count of stores these are on average much smaller stores with smaller footprints. On the other hand, Wales has the highest average floorspace across much fewer stores.
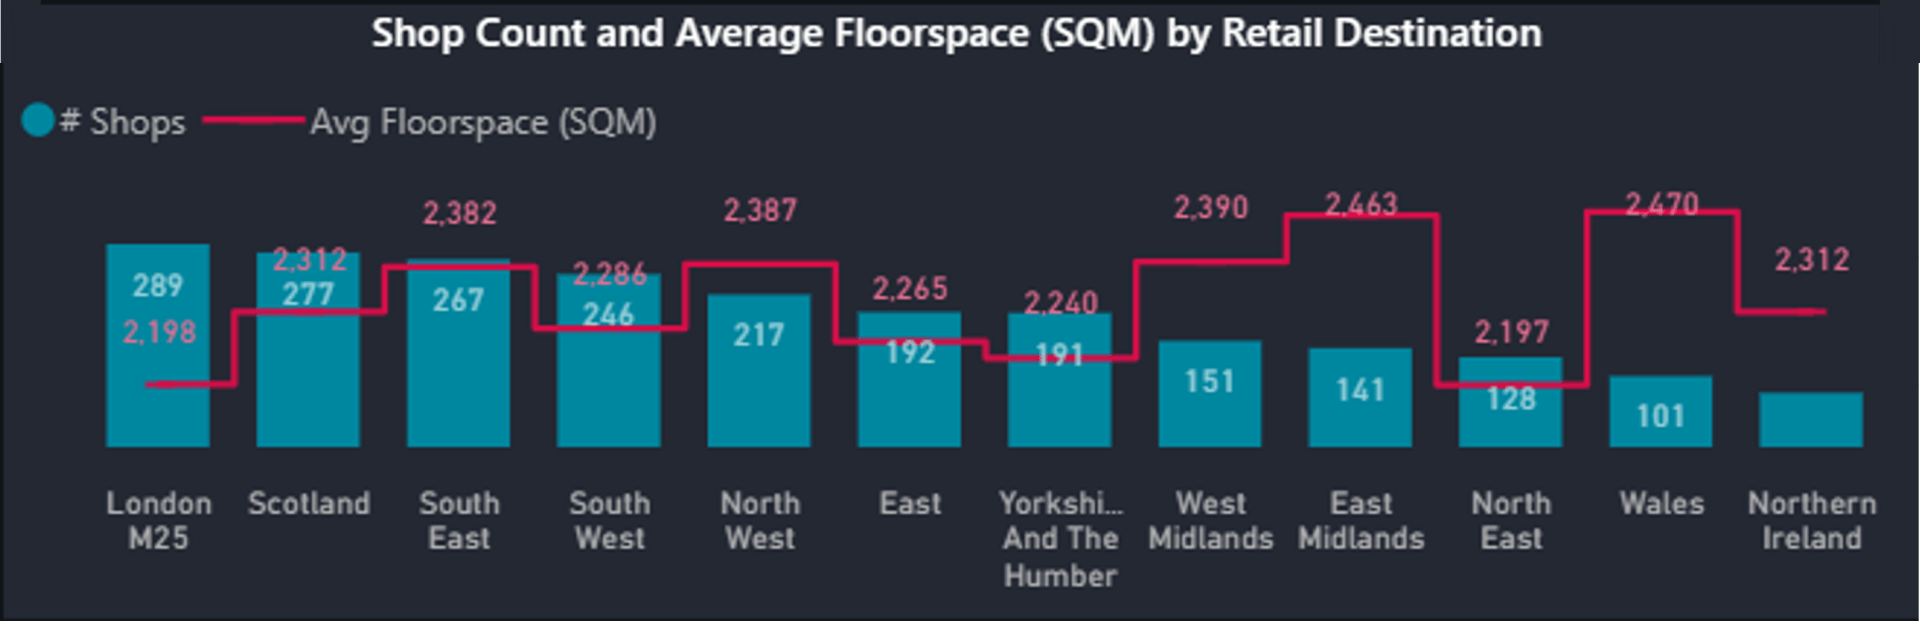
Figure 5
Looking at Boots’ revenue performance compared to its competitors in Figure 6, they have a higher Sales per m² than their next biggest competitor, Superdrug. On average, they approximately sell £700 per m² which is approximately £200 per m² below the average. If EG Group are to buy Boots, can they get the average sales by floorspace above the average?
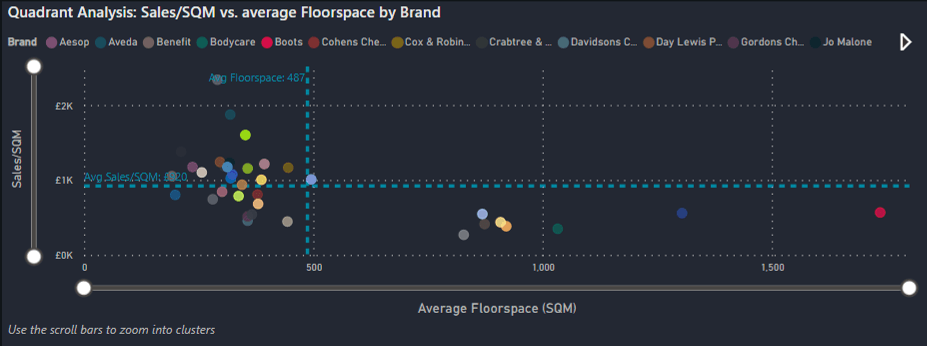
Figure 6
We took the data used in this blog from the latest version of our RetailVision Dashboard Tool. With our interactive dashboard, which is updated quarterly, you can quickly visualise and analyse the UK retail landscape. Figure 7 shows how you can quickly understand and analyse a brand’s location strategy. This could help you with multiple business initiatives, for instance quickly summarise your competitor’s location strategy or look at that of any of your affinity brands that you know you align well with.
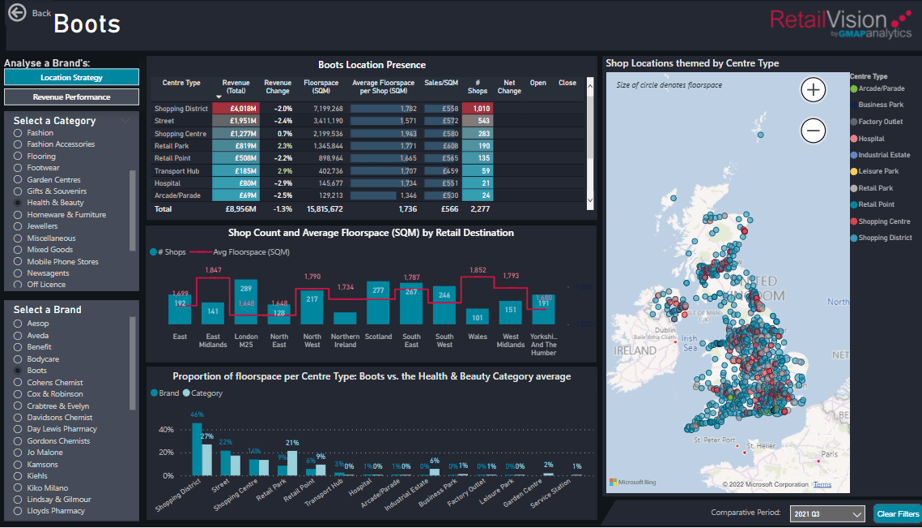
Figure 7
Get In Touch
The RetailVision Dashboard Tool
has numerous capabilities. For example, it can also be used to compare Retail Centres, Trade Zones and Super Trade Zones nationally, or drill down to specific areas, centre types or categories. To find out more about the RetailVision
Points store location
dataset, RetailVision Destinations, or the RetailVision Dashboard Tool, get in touch at info@gmap.com.