

RetailVision Refreshed: Introducing GMAP's Enhanced RetailVision Product & Insight
5th July 2021


GMAP
are proud to announce
the transformation of our RetailVision product is complete! RetailVision
has been serving UK property portfolio managers for many years. However, the impacts of COVID-19 on retail led us to transform RetailVision to ensure our clients get the insight required as they look to navigate the unprecedented retail landscape
created by the pandemic.
Q2 2021 RetailVision’s enhancements include:
- The addition of geo-mobility footfall data – a fantastic resource for understanding where customers are travelling from, catchment populations and how their destination preferences are changing over time.
- A list of store openings and closures per Retail Destination – understand your competitors’ actions and the estimated impact this has on the retail landscape.
- Highly detailed Retail Centre polygons drawn using the buildings physical footprint.
- Quarterly updates – be at the coal face of retail developments and gain time-period insights.
RetailVision Insight
“… did the South East turn to booze in the third national lockdown whilst the North West indulged in pastries and pies?”
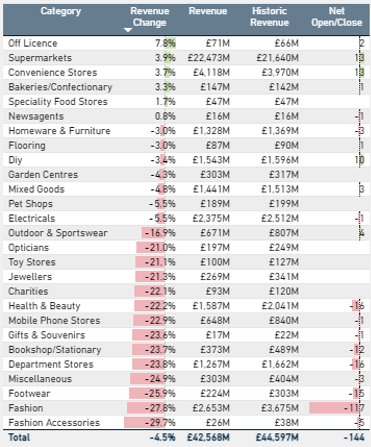
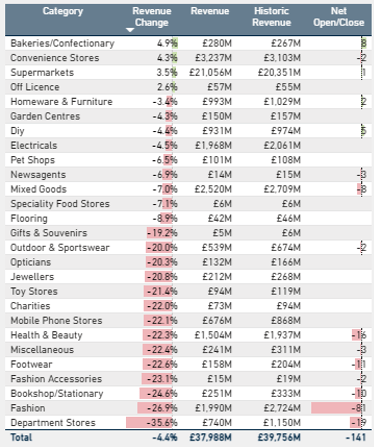
Naturally, we have been very eager to delve into RetailVision! As a starting point, it is interesting to see how the different regions have coped with lockdown. If we look at the biggest % revenue changes by category and compare to the previous period,
did the South East turn to booze in the third national lockdown whilst the North West indulged in pastries and pies?
Category Revenue Change in the South East vs. North West
From a national perspective, the update measured a net loss of -1,184 stores. New openings are predominantly restricted to Supermarkets and C-stores, but DIY brands such as Tool Station and Screwfix are under-going rapid store portfolio expansion, along with value stores such as B&M. Unsurprisingly, store closures have been dominated by fashion brands, driven by the breakup of the Arcadia Group and Debenhams.
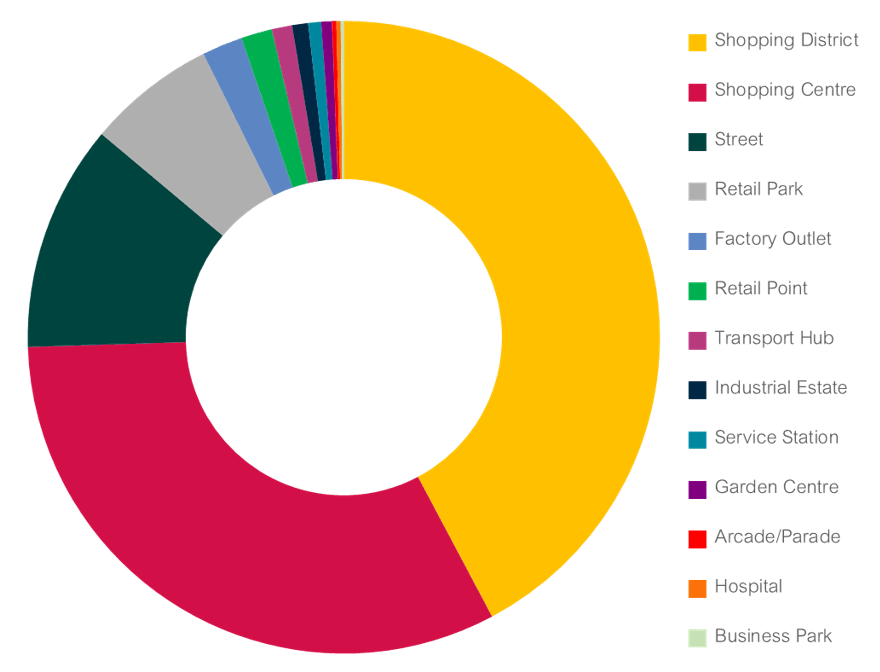
Predominantly Shopping Districts and Shopping Centres
have been most impacted by store closures; of 1,967 closures
that took place, 772 were in Shopping Districts and 590 in Shopping Centres. The “Oxford and Regent Street” Shopping District had 15 store closures, the highest in the country, reducing retail floorspace by over 500,000 sq. ft, with the demise of the Debenhams flagship accounting for over a third of the Centre’s decline. The “Oxford and Regent Street” Revenue declined by 24.3%, this was largely due to store closures, however the temporary closure of non-essential stores and the decline in footfall during the lockdown also played a major part in this.
National Closures by Centre Type
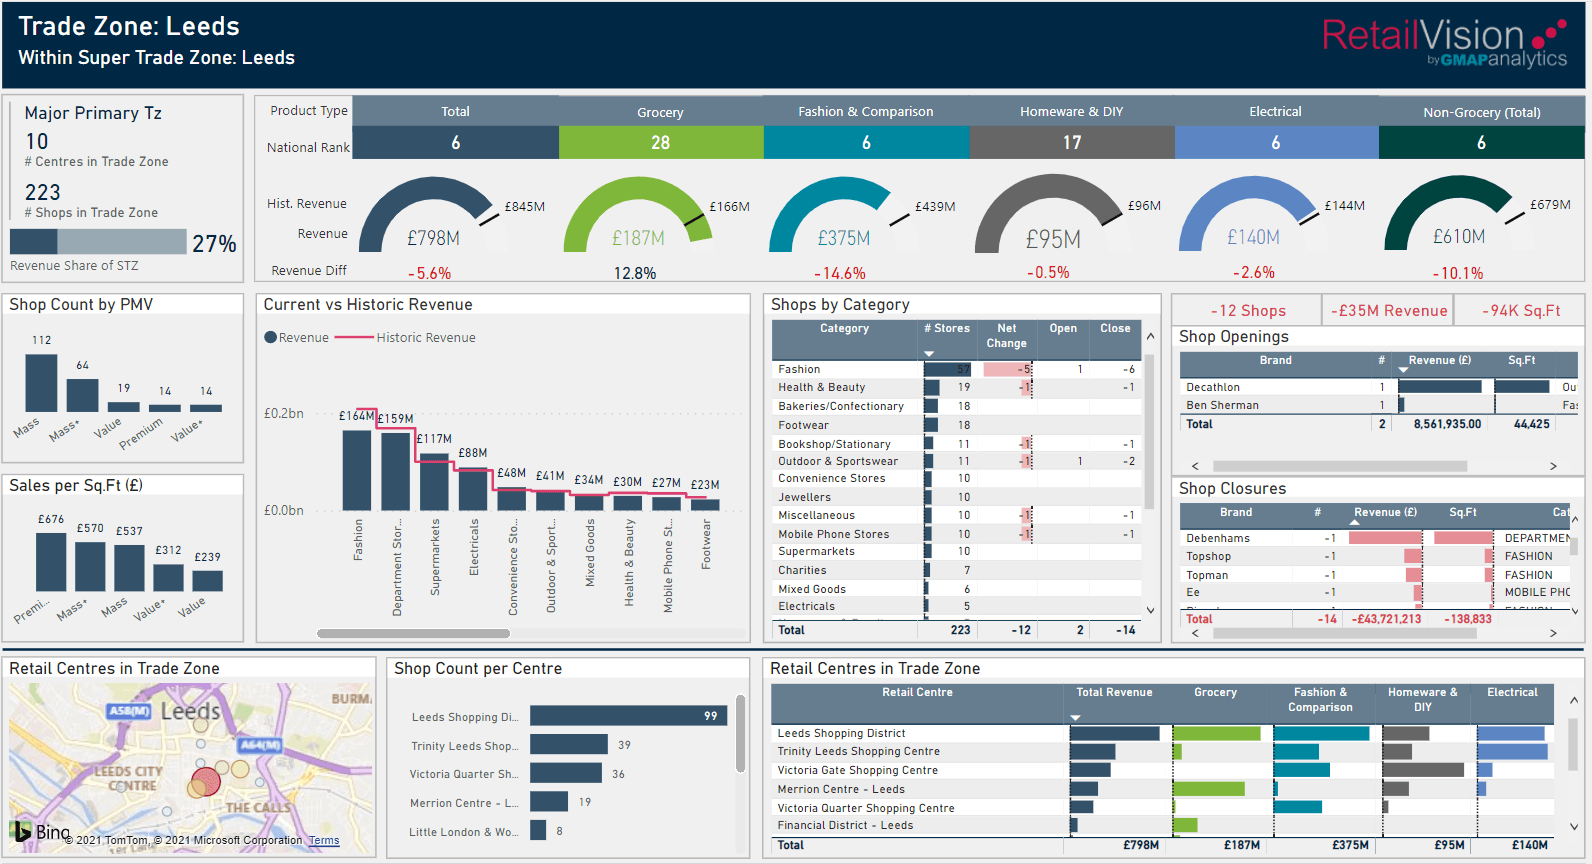
Looking further north to GMAP’s doorstep, the "Leeds Trade Zone" (which includes Leeds Shopping District, Leeds Trinity Shopping Centre, Victoria Quarter Shopping Centre, and the Train Station) has seen a -5.6% reduction in Total Revenue. Further inspection shows Grocery has increased 13%, whilst Fashion and Comparison has contracted -15%. In terms of stores opening, we have a new Decathlon (which one of our team members was perhaps a little too excited about!). Of course, like the rest of the UK, Leeds has seen numerous store closures, 14 in total, resulting in a loss of -£35m and -94k sq. ft. of retail floorspace. These details can all be explored in the new RetailVision Reporting Dashboard:
We have only touched the surface of the intelligence RetailVision provides. Looking forward, we will continue to bring you instalments of RetailVision Insights
as well as other perspectives RetailVision can offer, such as comparing the catchments of Retail Destinations, both over time and across different Centre Types using geo-mobility footfall data.
Let us know if you have any burning questions you would like us to investigate, or if the pie versus alcohol consumption rings true for you! Find out more about RetailVision
or get in touch at info@gmap.com
to request a sample of the dataset or organise a demo of the RetailVision Dashboard Reporting Tool.