

Electric Revolution? The 5 Year Trend of New and Used Cars in the UK
14th June 2022
It’s no secret that the current car market has faced a number of challenges, predominantly brought on by the COVID-19 pandemic. Whilst new vehicles are facing production issues caused by a global semiconductor chip shortage, used vehicle demand has spiked. Demand for used cars has outpaced supply, causing a significant increase in the price of such vehicles, and dealerships have been unable to replace stock fast enough to meet requirements.
At GMAP we used our DVLA Vehicle Registrations data set
to investigate how New and Used Car Transactions have changed across the last five years. We compared the 2017Q1 release to the most recently available data, 2022Q1. Due to the widely reported growth of Battery Electric Vehicles (BEVs), we also looked at how individual propulsion types had changed throughout this period. From this, we compared traditional Internal Combustion Engine (ICE) cars, Petrol and Diesel, against BEVs. Hybrids or variants of were excluded from this data. Watch the video in Figure 1 to see the changes in New and Used Car Transactions between the first quarter of 2017, compared to the first quarter of 2022:
Figure 1: 5-Year Trends in New and Used Car Transactions between 2017 and 2022
New Transactions
In general, the new car market has seen a decline in transaction volume from 2017 to 2022 . The total number of Petrol, Diesel and BEV transactions for the latest quarter was only around 38% of the volume witnessed in 2017Q1. Looking at the data quarter by quarter, transaction volume has been on the decline since our initial time period with no single quarter exceeding the volume seen in 2017Q1. As expected, the lowest volume of new transactions was seen in 2020Q2 as the UK entered it’s first lockdown from the COVID-19 pandemic. The lockdown ground the UK car market to a halt with all dealerships having to close their doors to the public. As a result, the new car transaction volume witnessed in this quarter was less than a fifth of the volume from the initial quarter in this analysis. Every other quarter, bar one, had at least double the volume of this pandemic-stricken quarter.
The petrol and diesel car volumes followed a similar pattern to the total market. This is unsurprising given that ICE vehicles form the majority of the UK car market. Diesel has seen the largest decline, with the latest quarterly volume being at less than 10% of the 2017Q1 volume. This latest quarters volume is very close to the 2020Q2 volume seen during the COVID-19 lockdown. Surprisingly, the lowest quarterly volume came in 2021Q4, rather than during any lockdown. Diesel volume has not shown any signs of recovery since the pandemic with no quarter since 2020Q2 having volume higher than pre-pandemic levels. In fact, annual Diesel sales from 2017-2021 have been on a constant decline with total Diesel volume almost halving from 2017 to 2019, and 2021 reporting the lowest total Diesel volume in this data. Diesel sales have suffered since the 2015 “Dieselgate” scandal and a number of negative headlines surrounding their car emissions have compounded their lack of popularity. Residual value is also a concern with the UK Government announcement of outlawing the sale of new petrol and diesel cars from 2030.
Petrol remains the dominant fuel type compared to diesel and BEV with around 70% of the total share. This has remained stable over the last 3 years. Whilst petrol has witnessed a steady decline in volume, it is far from the extent of diesels decline. Since 2017Q1, petrol’s lowest volume came in 2020Q2, as expected, but it has been able to hold its market position in comparison to diesel. Whilst petrol has maintained around 70% of the market over the last three years when compared to diesel and BEV, diesel has seen a decline from around 28% in 2019, down to 15% in 2021.
The key highlight from our data is the growth of BEV. It’s safe to say that the BEV market is in its infancy but it is growing at a rapid pace. In comparison to ICE vehicles, new BEV transactions in 2017 made up less than 1% of the market. This has grown substantially. In 2022Q1, the most recently available data, BEV share vs ICE is now over 20% of new car volume. Whilst diesel has been on a decline, BEV has taken its place as the number two fuel type. In the last three quarters, 2021Q3, 2021Q4 and 2022Q1, BEV volume was higher than diesel and in the last two quarters it was more than double diesel volume for new car transactions.
Consumers are evidently favouring “greener” vehicle options and potentially viewing a new BEV purchase as a more future-proof investment with the demand for these vehicles increasing. This growth has been constant. Even whilst in the middle of a semiconductor shortage, new BEV registrations have increased almost every quarter, with the exception of 2021Q1, since the pandemic began. With consumer attitudes changing and with more and more BEV models being released into the market, it is likely we will see this trend continue. There is still a long way to go for new BEV volume to overtake petrol, however it seems likely that we will see this in the not-too-distant future based on the rate of BEVs growth.
Figure 2a: New Car Registrations by Year 2017 - 2022
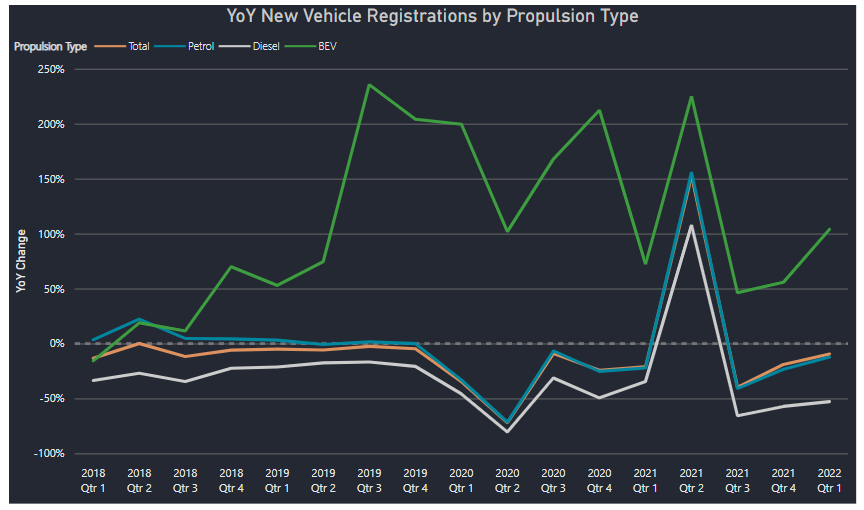
Figure 2b: YoY New Car Registrations by Propulsion Type Between 2017 - 2022
Used Transactions
With the decline in new car transactions being apparent, has this had an impact on the used car market? A declining new car market also means a declining supply of cars entering the used car market after initial ownership and lease agreements come to an end, however the recent production problems with new cars has ensured that the used car market remains buoyant.
The used car market has seen a slight decline in volumes between 2017Q1 and 2022Q1 but it is far more stable than what has been witnessed in the new car market. The volumes in the latest quarters data were at about 80% of those observed in 2017Q1. From 2017Q1 to the point of the lockdown in 2020Q2, every quarter was lower than the initial 2017Q1 volume but were all within 80+% with an average volume of over 90%. Thus, showing a much more stable used market in comparison to new. As expected, the lowest volume was observed in 2020Q2, however there was an immediate rebound with 2020Q3 having the highest volume since 2017Q1. With pent up demand caused by the lockdown, and with global new car production slowing, consumers seemingly turned their attention to the used market. It is worth noting that whilst 2020Q2 was the lowest quarter for used volume, with around 50% of the volume seen in 2017Q1 and YoY in 2019Q2, it wasn’t impacted anywhere near as badly as the new market. It has been widely reported that demand for used cars and their prices have soared over the last 12 months as a result of the shortage of stock entering the market, some used vehicles even selling for a higher price than when they were new. As the UK faces a cost living crisis, it will be interesting to see if this trend continues.
The fuel type variances in the used market are far more consistent throughout the data compared to the new market. Petrol and diesel make up almost the full market with 60:40 split, with only a couple of percentage points variance between years. In comparison to the new market where diesel share dropped dramatically over time, the used market has very little change across the time period within our data. In contrast to the new transactions data, used petrol volume has seemingly declined faster than diesel. Used petrol volume in 2020Q2 was less than half of the volume versus 2017Q1 at around 46%, diesel showed a close, but milder decline managing to stay above 50% of the 2017Q1 volume.
Used BEV transactions have continued to grow, although not to the extent of the new market. As more and more BEVs reach the end of leasing agreements and initial ownership, more become available to the used market. This will see this area of the market inevitably grow as BEVs become more widely available and accessible to consumers eager to make a “greener” purchase for their next vehicle. This is emerging in the recent data with used BEV transactions in 2022Q1 being more than double those seen in 2021Q1. Used BEV transactions made up around 1% of the total compared to ICE in 2022Q1, up from around 0.1% in 2017. In fact, 2022Q1 had more used BEV transactions than the whole of 2019 which goes to show that this is growing at a rapid pace. This will continue to grow, and we will likely see a spike in growth in 2-3 years as the current growth in new BEVs transition into the used market.
Figure 3a: Used Car Registrations by Year 2017 - 2022
Figure 3b: YoY Used Car Registrations by Propulsion Type Between 2017 - 2022
Summarising What's Changed Between 2017 and 2022?
This blog has highlighted 5-year trends in our DVLA registrations data for both new and used cars, specifically looking at petrol, diesel, and electric cars. We’ve been able to assess the impact that the COVID-19 lockdown had on this, how the market has recovered as well as what the future of the market may hold. In the new car data, it is clear to see that BEVs growth is outpacing ICE vehicles and has consistently grown over the 5-year period whereas the total market has declined. BEV has seemingly established itself as the number two fuel type, overtaking diesel. The used market is far more stable with petrol and diesel remaining the dominant fuel types but BEVs growth is starting to filter through into the used market. The used BEV market is in its infancy, and we will likely see larger growth in the coming years.
Get In Touch
If you feel that our bespoke DVLA data extracts
could add value to your organisation, or would like to find out more about our Dashboard Reporting
capabilities used to visualise the 5-year changes, then please get in touch at info@gmap.com.